
HPjmeter 4.2 User's Guide

Bring Console to Front
Bring console to the front of all other HPjmeter visualizers
and viewers.
Compare Data
Compare data from one or more comparable data sets. For
details, see Comparing Profiling Data Files (page 71) or
Comparing Garbage Collection Data Files (page 86).
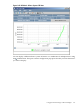
Refresh Data
Refresh the visualizer presentation. When viewing a live
monitoring session, the refresh will be a new snapshot of the
current state of the application. When viewing vgc data, the
refresh will update the visualizer with the most recent data
from a log file.
Print
Print the data presented in the visualizer pane.
Save to File
Save data from a metric display into a file for later viewing.
For example, a graphic display of a metric will be saved as a
Portable Network Graphics (PNG) file for viewing in software
that can interpret this file type.
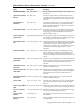
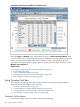
Tool Bar Buttons for Manipulating Tabular Data
These buttons appear depending on the metric in the visualizer.
Find
Brings up a dialog for keyword entry to start a search
through the data. See Find a Search Pattern (page 179) for
details.
Find Immediately
Immediately start searching on current keyword. See Find
a Search Pattern (page 179) for details.
Mark
Mark an item for search across visualizers. See Mark an
Item for Search (page 178) for details.
Find Previous Selected Item
Cycle back to a previously selected item. See Find a Search
Pattern (page 179) for details.
Find Next Selected Item
Cycle forward to a previously selected item. See Find a
Search Pattern (page 179) for details.
Refresh Live Objects
Collect data and immediately display live objects in the
heap at that moment.
Copy Selection to Buffer
Copy a selected portion of the current data display into a
buffer. Use standard keyboard shortcuts to paste this
temporarily stored data into a spreadsheet or other similar
document.
Copy All to Buffer
Instantly copy all of the current data display into a buffer.
Use standard keyboard shortcuts to paste this temporarily
stored data into a spreadsheet or other similar document.
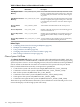
Tool Bar Buttons for Manipulating Graphical Data
These buttons appear depending on the metric in the visualizer.
Unfreeze Display
Allow the display to continue to scroll as data is updated. SeePause
or Resume Graphical Time-based Scrolling (page 181) for details.
Freeze Display
Stop the data display from scrolling. See Pause or Resume Graphical
Time-based Scrolling (page 181) for details.
Tool Bar Buttons for Manipulating Garbage Collection Data
These buttons appear depending on the metric in the visualizer.
Using Visualizer Tool Bars 177