
HPjmeter 4.2 User's Guide
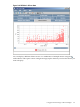
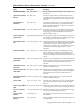
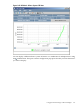
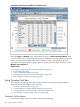
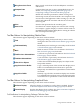
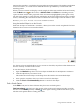
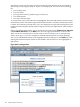

Table 8-2 Metrics Shown in Glance Adviser Visualizer (continued)
Description
HP GlancePlus Dictionary
Metric Name
Glance Adviser Metric
Name
Size (in KBs unless otherwise indicated) of the total virtual
memory occupied by data regions of this process. This value
PROC_REGION_VIRT_DATA
Data Region Virtual
Memory
is not affected by the reference count since all data regions
are private.
Size (in KBs unless otherwise indicated) of the total resident
memory occupied by data regions of this process. This value
PROC_REGION_RES_DATA
Data Region Resident
Memory
is not affected by the reference count since all data regions
are private.
Total number of kernel threads for the current process.
PROC_THREAD_COUNT
Process Kernel
Threads
Number of files the current process has remaining open as
of the end of the interval.
PROC_FILE_OPEN
Process Open Files
Number of physical IO KBs per second used by this process
or kernel thread, either directly or indirectly, during the
interval.
PROC_IO_BYTE_RATE
Process Physical IO
Rate
Average number of physical disk IOs per second made by
the process or kernel thread during the interval.
PROC_DISK_PHYS_IO_RATE
Process Physical Disk
IO Rate
Related Topics
• Collecting Glance Data for Viewing in HPjmeter (page 83)
• Multiple User-Defined (page 168)
• Using Visualizer Tool Bars (page 176)
• Changing Time Interval in GC Data Visualizers (page 181)
• Basic Garbage Collection Concepts (page 87)
Glance System Call Data
The Glance System Call display provides a graph of data obtained from the PROC_SYSCALL
loop in Glance Plus. For additional details, see the HP GlancePlus for HP-UX Dictionary of Operating
System Performance Metrics. At each sampling interval, all system calls that exceed a predefined
rate are written to the data file. Six items are recorded for each system call. They are shown
below, with the GlancePlus items they correspond to in parentheses:
• Count for this system call since the last sample (PROCSYSCALL_CALL_COUNT)
• Cumulative count for this system call (PROCSYSCALL_CALL_COUNT_CUM)
• Rate for this system call (PROCSYSCALL_CALL_RATE)
• Cumulative rate for this system call (PROCSYSCALL_CALL_RATE_CUM)
• Time spent in this system call (PROCSYSCALL_TOTAL_TIME)
• Cumulative time spent in this system call (PROCSYSCALL_TOTAL_TIME_CUM)
These metrics provide information about the system call behavior of the selected process. You
can use the display to look for high system call activity.
174 Using Visualizer Functions