
HPjmeter 4.2 User's Guide
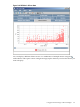
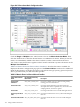
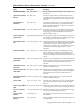
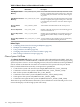
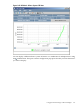
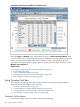
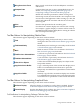
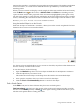
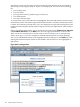

Figure 8-41 Glance Data Metric Configuration Box
Click the Single or Multiple metric radio button to choose the Metric Selection Mode. Then
click the check boxes to select the desired metric or combination of metrics. When you check a
metric, it is immediately added to the chart. Uncheck it, and it is removed from the chart.
You can also view these metrics together with GC metrics and Glance system call metrics on the
Multiple User-Defined tab.
Table 8-2 “Metrics Shown in Glance Adviser Visualizer” describes the metrics available for
display in the metric configuration pop-up box of the Glance Adviser visualizer. For additional
detail on these metrics, see the HP GlancePlus for HP-UX Dictionary of Operating System Performance
Metrics provided with your HP GlancePlus product.
Table 8-2 Metrics Shown in Glance Adviser Visualizer
Description
HP GlancePlus Dictionary
Metric Name
Glance Adviser Metric
Name
Percent of available swap space that was being used by
running processes in the interval.
GBL_SWAP_SPACE_UTIL
Global Swap
Utilization
Percentage of file table entries currently used by file
descriptors.This metric is updated every 30 seconds or the
sampling interval, whichever is greater.
TBL_FILE_TABLE_UTIL
Global File Table
Percentage of time the CPU was not idle during the interval.
GBL_CPU_TOTAL_UTIL
Global CPU
Percentage of time the CPU was in system mode during the
interval.
GBL_CPU_SYS_MODE_UTIL
Global System Mode
CPU
Percentage of time the CPU was in user mode during the
interval.
GBL_CPU_USER_MODE_UTIL
Global User Mode CPU
172 Using Visualizer Functions