
HPjmeter 4.2 User's Guide
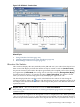
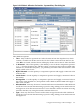
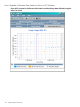
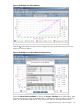

When displaying multiple metrics, HPjmeter tries to share the default y-axis if possible. If not,
it creates additional y-axes to the right of the graph, in units appropriate to the selected metrics.
For example, Figure 8-38 (page 169) shows four metrics, but only three y-axes. The units for the
Heap Usage After GC and Old After metrics are MBytes, so they share the same default MBytes
y-axis to the left of the graph. The GC Count units are in integers (indicated by Count), and the
Cumulative GC Duration units are in seconds, so they are each given their own y-axis.
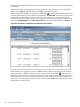
For a partial list of available metrics, see -Xverbosegc and -Xloggc Options and Their
Corresponding Metrics (page 85).
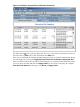
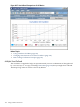
If Glance data was collected, then the Glance metrics are also included for selection in the metric
configuration pop-up box.
Related Topics
• Using Visualizer Tool Bars (page 176)
• Glance Data (page 170)
• Changing Time Interval in GC Data Visualizers (page 181)
• Basic Garbage Collection Concepts (page 87)
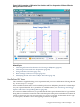
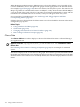
Glance Data
The Glance Adviser visualizer displays a subset of HP GlancePlus metrics collected during a
Java application run.
Requires use of the /opt/hpjmeter/bin/javaGlanceAdviser.ksh command to collect
Glance data:
See Collecting Glance Data for Viewing in HPjmeter (page 83) for an example of command
syntax.
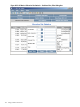
The metrics display as the Y-axis values on the graph. These metrics provide information about
the global state of the HP-UX server and the specific process that was selected by process id (pid)
when the Glance data collection was started. By default, the visualizer displays the Process CPU
metric:
170 Using Visualizer Functions