
HPjmeter 4.2 User's Guide
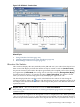
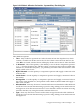
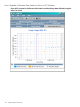
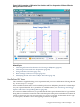
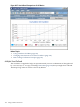
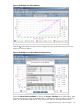

Figure 8-36 Presentation of Allocation Sites Statistics and Zero Preparation GC Data Collection
During the Same Time Period
Related Topics
• Collecting Allocation Site Statistics for Viewing in HPjmeter (page 83)
• Collecting GC Data with Zero Preparation (page 83)
• Using Visualizer Tool Bars (page 176)
• Basic Garbage Collection Concepts (page 87)
• Identifying the Site of Excessive Object Allocation (page 44)
User-Defined X-Y Axes
This visualizer is supplied to help you to experiment with your own combinations of data gathered
by -Xverbosegc or -Xloggc.
Select variables for the X and Y axes from the drop-down lists. HPjmeter plots the X-Y relationships
for your captured data file. For a partial list of available metrics, see -Xverbosegc and -Xloggc
Options and Their Corresponding Metrics (page 85).
For some user-defined selections, it is possible that the data capture obtained the GC type without
being able to ascertain the numerical value of the data point. Data points with unknown numerical
values are shown in gray near zero (0) on the X or Y axis of a graph. To determine the GC type
of a data point, check the color in the legend given below the graph.
Using Specialized Garbage Collection Displays 167