
HPjmeter 4.2 User's Guide
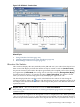
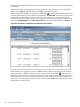
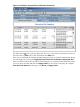
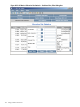
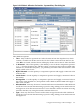
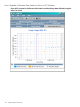
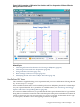
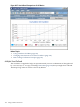
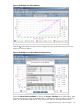
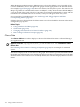

Figure 8-30 GC Metric: Creation Rate
Related Topics
• Using Visualizer Tool Bars (page 176)
• Changing Time Interval in GC Data Visualizers (page 181)
• Basic Garbage Collection Concepts (page 87)
Allocation Site Statistics
This visualizer displays the sites (methods) in the JDK and user's Java code where objects have
been created. The display includes the number of objects created at each site (Invoke Count),
the percent of memory allocated to the objects generated by the compiled portion of the running
Java application (% Allocated), the average size of each object in bytes (Average Size (Byte)),
and the amount of memory occupied by the objects (Bytes Allocated). This metric is useful
when you choose to decrease heap pressure by modifying the application code.
The data displayed in this visualizer can be refreshed from the verbose GC file during the
collection period by clicking the button. The data display shows the cumulative results of all
the dumps of the allocation sites statistics collected up to that point or the different allocations
separated by time.
Requires use of -XX:+PrintAllocStatistics in the run command:
See Collecting Allocation Site Statistics for Viewing in HPjmeter (page 83) for an example of
command syntax.
Allocation sites can originate from interpreted as well as compiled Java code. When specifying
–XX:+PrintAllocStatistics, only allocations from compiled code are reported. However,
because the Java Virtual Machine detects and compiles the most active Java methods as early as
Using Specialized Garbage Collection Displays 161