
HPjmeter 4.2 User's Guide
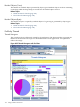


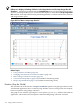
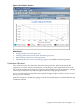

Figure 8-28 GC Metric: Duration
Related Topics
• Using Visualizer Tool Bars (page 176)
• Changing Time Interval in GC Data Visualizers (page 181)
• Basic Garbage Collection Concepts (page 87)
• Identifying Excessive Calls to System.gc() (page 41) (available in monitoring mode)
Cumulative Allocation
This visualizer shows the cumulative amount of storage for new objects requested by the
application over time, which can indicate the overall progress of the application. Because the
rate at which an application creates new objects is often an indicator of its performance, changes
in the slope of this curve may indicate opportunities for tuning garbage collection.
To see a more dramatic presentation of incremental changes in object creation, see the Creation
Rate (page 160) visualizer.
Note that storage recovered by the garbage collector for unused objects is not deducted from the
cumulative amount.
Using Specialized Garbage Collection Displays 159