
HPjmeter 4.2 User's Guide

NOTE:
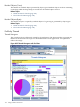
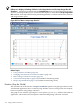
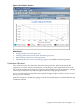
Difference in Display of Garbage Collection in the Heap Monitor and the Heap Usage After GC
Visualizers Monitoring visualizers like the Heap Monitor show only object data from the eden,
survivor, and old generation spaces. Visualizers that display GC data, like the Heap Usage After
GC visualizer, show object data from the permanent generation, as well as from the eden, survivor,
and old generation spaces.
Figure 8-27 GC Metric: Heap Usage After GC
Related Topics
• Using Visualizer Tool Bars (page 176)
• Changing Time Interval in GC Data Visualizers (page 181)
• Basic Garbage Collection Concepts (page 87)
• Current Live Heap Objects (page 129) (available in monitoring mode)
• Heap Usage Notification (page 111) (available in monitoring mode)
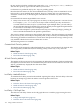
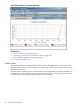
Duration (Stop the World)
This visualizer shows the amount of stop-the-world time spent for each garbage collection event.
A well-tuned application shows a relatively large number of short scavenges with less frequent,
but more expensive, full garbage collections.
This graph is also useful for exposing the cost of explicit System.gc() method calls within an
application, which often result in expensive and unneeded garbage collection overhead.
158 Using Visualizer Functions