
HPjmeter 4.2 User's Guide


Related Topics
• Mark an Item for Search (page 178)
• Find a Search Pattern (page 179)
• Using Heuristics to Locate Possible Hot Spots (page 78)
• How Memory Leak Detection Works (page 189)
• Java Collection Leak Locations Alert (page 111) (available in monitoring mode)
• Array Leak Locations Alert (page 112) (available in real-time mode)
Using Specialized Garbage Collection Displays
GC data displays are available immediately on opening a .vgc file that was generated by running
your application with -Xverbosegc or -Xloggc options. This data is presented in the following
visualizers:
• Heap Usage After GC (page 157)
• Duration (Stop the World) (page 158)
• Cumulative Allocation (page 159)
• Creation Rate (page 160)
• Allocation Site Statistics (page 161)
• User-Defined X-Y Axes (page 167)
• Multiple User-Defined (page 168)
• Glance Data (page 170)
• Glance System Call Data (page 174)
See also:
• Basic Garbage Collection Concepts (page 87)
• Profiling Applications (page 58)
• Using Visualizer Tool Bars (page 176)
• Viewing Profiling or GC Data in HPjmeter (page 137)
For an explanation of Java memory terminology, see the Sun Developer Network publication
Memory Management in the Java HotSpot™ Virtual Machine (.pdf)
For an explanation of Java memory terminology, see the Sun Developer Network publication
Memory Management in the Java HotSpot™ Virtual Machine
(http://java.sun.com/j2se/reference/whitepapers/memorymanagement_whitepaper.pdf)
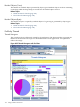
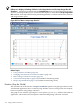
Heap Usage After GC
This visualizer shows heap usage in the eden space and in the old, survivor, and permanent
generations after each garbage collection. When viewed with consideration of the type of each
event, this graph provides a general picture of the heap resources minimally required by an
application.
Using Specialized Garbage Collection Displays 157