
HPjmeter 4.2 User's Guide
Related Topics
• Inclusive Versus Exclusive Time (page 69)
• Time Units (page 69)
• Mark an Item for Search (page 178)
• Find a Search Pattern (page 179)
Exclusive Class Lock Delay*
The total of the Exclusive Method Lock Delay, summed over all methods of the class. To see the
list of all contributing methods, double click on the class name. If a class is used as a monitor
with many synchronized methods, the individual methods may not exhibit excessive lock
contention, but the problem might get visible using this metric.
Related Topics
• Inclusive Versus Exclusive Time (page 69)
• Mark an Item for Search (page 178)
• Find a Search Pattern (page 179)
Using Heuristic Metrics from the Estimate Menu
HPjmeter provides three estimated measures to aid in narrowing the field of your problem-solving
or performance tuning inquiry.
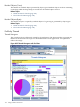
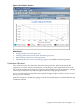
Inline Candidates
Use this estimate to see a list of packages, classes, and methods that are possible candidates for
inlining activity during processing. For some candidates, the table lists amount of time estimated
to be wasted during the execution of the method.
Use the Mark button to capture the method name, then use Find in other tabular metric visualizers
to locate the method in relation to the other data presented.
Related Topics
• Mark an Item for Search (page 178)
• Find a Search Pattern (page 179)
• Using Heuristics to Locate Possible Hot Spots (page 78)
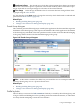
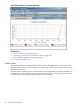
Exceptions Thrown
Use this estimation to obtain a list of methods, packages, and classes and a count of thrown
exceptions associated with each method or package.
Use the Mark button to capture the method name, then use Find in other tabular metric visualizers
to locate the method in relation to the other data presented.
Related Topics
• Mark an Item for Search (page 178)
• Find a Search Pattern (page 179)
• Using Heuristics to Locate Possible Hot Spots (page 78)
• Thrown Exceptions (page 120)(available in monitoring mode)
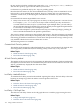
Memory Leaks
Use this estimation to obtain a list of packages and package types where leaks are suspected to
be occurring, and the amount of memory associated with each listed package.
Use the Mark button to capture the package name, then use Find in other tabular metric visualizers
to locate the method in relation to the other data presented.
156 Using Visualizer Functions