
HPjmeter 4.2 User's Guide
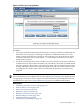
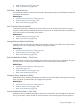
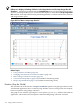
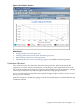

Figure 8-24 Class Types Pop-up Window
Guidelines
• Class types reside in the Permanent Generation space, which is usually more limited in size
than other areas of memory. Continuing incorporation of additional instances of a class
loader can begin to fill this area, creating an out-of-memory error in the Perm Gen region
of memory. Check the Class Loaders metric — are the number of instances of each class
loader what you expect?
• Use Mark and Find functions in the visualizers to locate references to the class loader and
its loaded classes in other related visualizers. Do you find any classes that you think should
have been garbage collected, but are not? Note how much space is held by the class loader.
Garbage collection cannot be thorough when application code has created a reference that
is keeping the class loader and its classes active beyond the time they are needed in the
program.
TIP: If you have instrumented the application with Java Management Extensions, you can also
open a monitoring session in HPjmeter and use the JMX Memory Tab (page 49) to quickly observe
a rough gauge of activity in various regions of the allocated memory, including the Perm Gen
and the Survivor space. See Using the JMX Viewer (page 47) for additional information.
Related Topics
• Identifying Too Many Classes Loaded (page 47)
• Mark an Item for Search (page 178)
• Find a Search Pattern (page 179)
• Reference Graph Tree (page 146)
• Reference Sub-Trees by Size (page 146)
• Residual Objects (Count) (page 152)
• Unfinalized Objects (page 146)
• Profiling with -agentlib:hprof (page 63)
Using Profile Displays 151