
HPjmeter 4.2 User's Guide
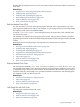
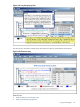
Call Graph Tree with CPU
The inclusive CPU time shown on the call graph.
Related Topics
• Using Call Graph Trees (page 75)
• Inclusive Versus Exclusive Time (page 69)
• Time Units (page 69)
• Mark an Item for Search (page 178)
• Find a Search Pattern (page 179)
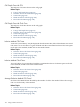
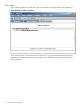
Call Graph Tree with Clock Time
The inclusive clock time shown on the call graph.
Related Topics
• Using Call Graph Trees (page 75)
• Inclusive Versus Exclusive Time (page 69)
• Time Units (page 69)
• Mark an Item for Search (page 178)
• Find a Search Pattern (page 179)
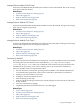
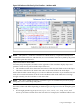
Inclusive Method CPU Times
A remark “(virtual times)” may be displayed after the metric title, if the collected times are virtual
CPU times. To see all callers of a given method with the accumulated inclusive CPU time spent
in all calls to this method, double click on the method name.
Related Topics
• Inclusive Versus Exclusive Time (page 69)
• Time Units (page 69)
• Mark an Item for Search (page 178)
• Find a Search Pattern (page 179)
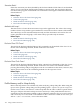
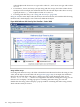
Inclusive Method Clock Times
To see all callers of a given method with the accumulated inclusive clock time spent in all calls
to this method, double click on the method name.
Related Topics
• Inclusive Versus Exclusive Time (page 69)
• Time Units (page 69)
• Mark an Item for Search (page 178)
• Find a Search Pattern (page 179)
Average Exclusive Method CPU Times*
Exclusive CPU Method Time divided by the number of calls to the method. This is the average
CPU cost for the body of the method.
Related Topics
• Inclusive Versus Exclusive Time (page 69)
• Time Units (page 69)
• Mark an Item for Search (page 178)
• Find a Search Pattern (page 179)
142 Using Visualizer Functions