
HPjmeter 4.2 User's Guide
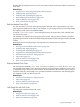
Double-click the method name to see a list of its callers with the cumulative number of calls from
each caller.
Related Topics
• Approaches to Analyzing Performance Data (page 68)
• Profiling with -Xeprof (page 61)
• Profiling with -agentlib:hprof (page 63)
• Data Sampling Considerations (page 188)
• Mark an Item for Search (page 178)
• Find a Search Pattern (page 179)
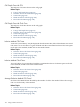
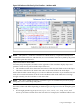
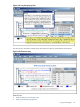
Exclusive Method Times (CPU)
Use this visualizer to see CPU time spent by methods found in the captured data. CPU time
spent is given in milliseconds, and for each method, as a percentage of all CPU time used during
the capture period. Times are exclusive times.
A remark "(virtual times)" may be displayed after the metric title, if the collected times
are virtual CPU times.
The methods are sorted by decreasing time spent in CPU. The gray horizontal bars provide a
graphical representation of the time a method spent (in milliseconds) for the period of the collected
sample.
Other data shown include packages and arguments associated with each method.
Related Topics
• Average Exclusive Method CPU Times* (page 142)
• Profiling with -Xeprof (page 61)
• Profiling with -agentlib:hprof (page 63)
• Approaches to Analyzing Performance Data (page 68)
• Inclusive Versus Exclusive Time (page 69)
• Time Units (page 69)
• Mark an Item for Search (page 178)
• Find a Search Pattern (page 179)
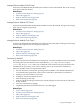
Exclusive Method Clock Times
The standard Java methods java.lang.Thread.sleep and java.lang.Object.wait are
not included in this metric. This is because usually the time spent in these methods is a few orders
of magnitude larger than in any other method. At the same time, the total time spent in sleep or
wait has hardly any relationship to any possible performance bottlenecks, and including these
two methods would only distract the user.
Related Topics
• Inclusive Versus Exclusive Time (page 69)
• Time Units (page 69)
• Mark an Item for Search (page 178)
• Find a Search Pattern (page 179)
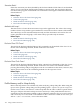
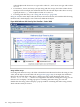
Call Graph Tree with Call Count
The call graph with the method call count.
Related Topics
• Using Call Graph Trees (page 75)
• Mark an Item for Search (page 178)
• Find a Search Pattern (page 179)
Using Profile Displays 141