
HPjmeter 4.2 User's Guide
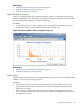
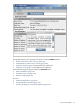

The profile displays are categorized as follows under the Metrics menu:
• Profile Code and/or CPU Activity (page 140)
• Profile Memory and/or Heap Activity (page 144)
• Profile by Threads (page 152) (Threads/Locks submenu)
• Profile by Locks (page 153) (Threads/Locks submenu)
These heuristic displays appear under the Estimate menu:
• Inline Candidates (page 156)
• Exceptions Thrown (page 156)
• Memory Leaks (page 156)
See also:
• Profiling Applications (page 58)
• Using Visualizer Tool Bars (page 176)
• Viewing Profiling or GC Data in HPjmeter (page 137)
Using Profile Displays 139