
HPjmeter 4.2 User's Guide

Related Topics
• Identifying Excessive Method Compilation (page 46)
• Method Compilation Frequency (page 135)
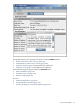
• Find a Search Pattern (page 179)
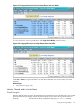
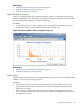
Method Compilation Frequency
Produces a graph that shows the compilation frequency. This is a companion to the existing
Method Compilation Count. The Method Compilation Frequency metric provides a view of how
much effort the JVM is spending on method compilation.
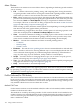
Guidelines
• A typical profile shows a lot of compilations as a Java application is starting up, then it
usually goes down to a small number as things reach a steady state.
Figure 8-16 Monitoring Metric: Method Compilation Frequency
Related Topics
• Identifying Excessive Method Compilation (page 46)
• Method Compilation Count (page 134)
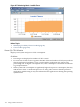
Loaded Classes
HPjmeter displays the number of classes loaded into memory for processing. This number usually
stabilizes over time as processing progresses.
Guidelines
• The number of classes loaded at any one time tends to oscillate within a narrow range;
typically less than 2 percent of all loaded classes will be unloaded or reloaded during
application processing.
• If the number of loaded classes constantly grows, it indicates a possibility that the new
classes, possibly dynamically created, may eventually fill the available memory and cause
the application to crash.
Using Monitoring Displays 135