
HPjmeter 4.2 User's Guide

Considerations When Comparing Lock Contention and Thread Histogram Metrics:
Lock contention data is sampled less frequently than thread histogram data. When there is lock
contention with a short lifespan, a small amount of lock contention might appear in the Thread
Histogram, but not be shown in the Lock Contention percentages. This can happen when the
contention occurs during a time when the Thread Histogram sample is being taken, but the lock
contention sample is not.
Related Topics
• Thread Histogram (page 131)
• Identifying Excessive Lock Contention (page 45)
• Identifying Deadlocked Threads (page 45)
• Data Sampling Considerations (page 188)
Monitor JVM and/or System Activity Menu
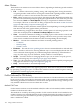
Method Compilation Count
Displays a list of all the methods compiled from the time the session was opened, showing the
number of times a particular method was compiled.
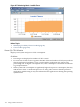
The metric window reports “No methods compiled since the session opened.” until the next
method compilation occurs, and then the metric data appears.
Guidelines
• The normal values for this metric are single-digit numbers.
• If the top item or items show a much larger value than the rest of entries, and the value
constantly grows, it suggests excessive method compilation.
• Normally, a method is compiled once or just a few times, which results in a very flat profile,
with none of the entries showing large numbers.
However, a JVM may have a performance problem in which a certain method, or methods,
is compiled repeatedly. Such a problem manifests itself in one entry clearly dominating the
list and showing constant growth over time.
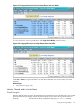
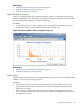
Figure 8-15 Monitoring Metric: Method Compilation Count
134 Using Visualizer Functions