
HPjmeter 4.2 User's Guide

Lock Contention The thread is delayed while attempting to enter a Java monitor that is
already acquired by another thread.
Running All remaining cases.
Guidelines
• Large amounts of red in Thread Histogram indicate heavy lock contention, which is usually
a possible problem. On the other hand, large amounts of green indicate a potential processing
capacity for the involved threads.
• When there is no load, the state for the threads doing the work on behalf of transactions
should be waiting, and marked by the green color.
• Threads terminating normally, or because of uncaught exceptions, appear as a discontinued
row.
• Multiple short-lived threads appear as apparently blank rows in the display. At the same
time the number of displayed threads, shown at the bottom of the display, is large.
• Lock Contention appears as red in the display.
• Deadlocked threads appear as two or more threads spending all their time in lock contention,
red, starting from a given time. This point in time identifies the deadlock occurrence.
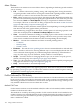
Details
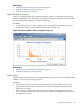
For each time slice, represented by a small portion of the X-axis, the display along the Y-axis
shows the percentage of the time slice that the thread spent in each state. It represents a stacked
bar graph for the time slice.
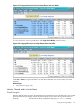
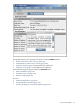
Figure 8-13 Monitoring Metric: Thread Histogram
Related Topics
• Identifying Abnormal Thread Termination (page 44)
• Identifying Multiple Short-lived Threads (page 44)
• Identifying Excessive Lock Contention (page 45)
• Change Color Selection for Histogram Display (page 185)
132 Using Visualizer Functions