
HPjmeter 4.2 User's Guide
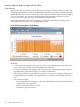
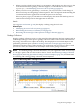
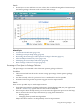
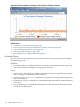
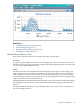
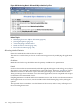
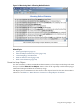
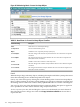

Figure 8-10 Monitoring Metric: Current Live Heap Objects
Table 8-1 Data Shown in Current Live Heap Objects Visualizer
DescriptionColumn Heading
Name of class to which object belongs
Class
Percent of allocated heap used
% Heap Used
Cumulative size occupied by the object (in bytes)
Bytes
The total change in the amount of bytes held for this class since the first snapshot
was taken.
+/- First Bytes
The change in the amount of bytes held for this class since the last snapshot was
taken (most recent increment).
+/- Last Bytes
Number of current live instances of the object class
Count
The total change in the number of objects held for this class since the first snapshot
was taken.
+/- First Count
The change in the number of objects held for this class since the last snapshot was
taken (most recent increment).
+/- Last Count
Details
When the heap is large with many objects, refreshing the snapshot will affect system performance
more than refreshing from a smaller heap with fewer objects.
Sort by any of the data types by clicking the column heading in the Current Live Heap Objects
table. Continue clicking on the same column heading to toggle the sort between ascending and
descending order for numerical columns and by alphabetical order for columns containing text.
You can copy all or part of the data displayed into a temporary buffer, then paste or append it
into a spreadsheet or other similar software using a keyboard shortcut.
To select a portion of the data, click and drag the cursor across the desired rows and columns of
data. The selected rows change color. Then click Copy Selection to Buffer in the tool bar to
capture the data.
130 Using Visualizer Functions