
HPjmeter 4.2 User's Guide
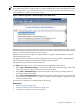
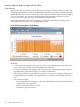
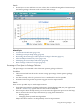
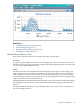
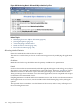
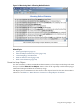
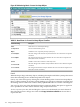

Figure 8-9 Monitoring Metric: Allocating Method Statistics
Related Topics
• JVM Agent Options (page 17)
• Allocated Object Statistics by Class (page 127)
• “Data Sampling Considerations”
• Mark an Item for Search (page 178)
• Find a Search Pattern (page 179)
Current Live Heap Objects
Use this visualizer to obtain an immediate data summary of live objects in the heap each time
that you click the Refresh Live Objects button. This can be especially useful when trying to
understand unexpected behavior in memory usage.
The display shows information for the classes of live objects found. It does not show indirect
references. See Table 8-1 “Data Shown in Current Live Heap Objects Visualizer”.
Using Monitoring Displays 129