
HPjmeter 4.2 User's Guide

Related Topics
• Unfinalized Queue Growth (page 115)
• Thread Histogram (page 131)
• Reading Profiling Histograms (page 73)
• Profiling with -Xeprof (page 61)
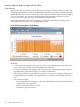
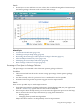
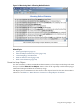
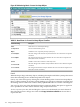
Allocated Object Statistics by Class
Shows object allocation statistics according to the object type allocated.
Guidelines
A typical large Java application allocates a lot of strings. This value can reach 25 percent of all
allocations. If any other type, especially an application-defined type approaches or exceeds such
a value, it may indicate inefficient code.
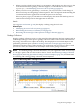
Details
For those classes that are instrumented (visible through the JVM agent verbose flag), every
object allocation in every method is instrumented to report allocations. However, sampling is
used to minimize overhead, so the metric reports allocation percentages, not total allocation
counts. These percentages are not absolute across the entire application, but are computed with
respect to allocations in instrumented classes.
Sampling minimizes overhead and focuses attention on user code. To discover allocation statistics
about application server classes, use the include and exclude filtering flags in the JVM agent
options.
The reported data is cumulative over the lifetime of the session, and accuracy will improve as
the session length increases.
Using Monitoring Displays 127