
HPjmeter 4.2 User's Guide

Details
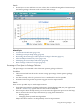
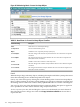
• For HP Java 1.5.0.12 and later or 6.0.01 or later, this visualizer distinguishes between major
and minor garbage collections such as full GC and scavenge.
Related Topics
• GC Duration Notification (page 110)
• Checking for Proper Heap Sizing (page 43)
• Reviewing the Percentage of Time Spent in Garbage Collection (page 41)
• Allocated Object Statistics by Class (page 127)
• Identifying Excessive Object Allocation (page 44)
• Basic Garbage Collection Concepts (page 87)
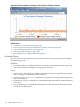
Percentage of Time Spent in Garbage Collection
The percentage is an estimated value of the time spent in garbage collection.
Guidelines
• The horizontal red line shows the current average percentage of time spent in garbage
collection.
• An almost steady value of 5 percent or less is considered low and acceptable.
• Sustained values larger than 10 percent suggest room for improvement.
Details
Here are two possible ways to make improvements:
• Tune the heap parameters for better performance. For HP HotSpot VM, run your application
with the -Xverbosegc option and view the results in HPjmeter.
• If the heap has been already tuned, you can decrease the application pressure on the heap,
that is, decrease the rate of object allocations, by trying these alternatives:
— Reusing objects
— Changing memory-inefficient algorithms
Object allocation statistics can help identify areas for improvement.
Using Monitoring Displays 125