
HPjmeter 4.2 User's Guide

NOTE: The data collection for Java Method HotSpots may be significantly delayed if one or
more of these conditions exist:
• The application runs on a single CPU system.
• The application does not consume a lot of CPU.
• The application consumes CPU exclusively in non-profiled methods.
Restarting the application server or node agent will not improve data collection.
Related Topics
• Identifying Unexpected CPU Usage by Method (page 39)
• Data Sampling Considerations (page 188)
• Time Units (page 69)
• Mark an Item for Search (page 178)
• Find a Search Pattern (page 179)
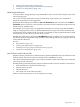
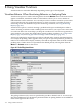
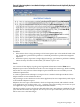
Thrown Exceptions
Displays thrown exception counts according to the exception type and the catching method. If
you need stack trace information, refer to Thrown Exceptions with Stack Traces (page 120).
The integer is a count of how many times this exception has been thrown in this location, and
caught by this method. The percentage gives information on how often this exception is being
thrown in relation to all the detected thrown exceptions.
HPjmeter collects and reports exceptions caught in classes that are instrumented, that is, classes
that the JVM agent instrumentation rules have not excluded. To identify the JVM agent rules in
effect, you can use the JVM agent verbose option.
HPjmeter does not collect or report exceptions that are caught in methods filtered out by the
exclude JVM agent option.
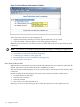
The display shows “No thrown exception detected since the session opened.” until HPjmeter
detects a thrown exception, at which time it displays the information.
The window shows events in a hierarchical tree.
The View menu allows you to control the information displayed in the window:
• Select View→Show Percentages to alternatively hide or show the percentage value of the
total count for each exception, shown next to the count value.
• Select View→Show Packages to alternatively hide or show the Java package names to
shorten the lines in the display.
The results are cumulative over the lifetime of the session.
Related topics
• Thrown Exceptions with Stack Traces (page 120)
• Setting Monitoring Session Preferences (page 100)
• Setting Data Collection Preferences (page 36)
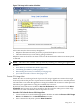
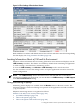
Thrown Exceptions with Stack Traces
Enable this metric in the Session Preferences window only when you need to get information
about where your applications throws exceptions. To view this data, click
Monitor→Code/CPU→Thrown Exceptions.
This metric displays thrown exception counts according to the exception type, the catching
method, and the stack trace of the throwing location.
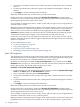
The integer is a count of how many times this exception has been thrown in this location, and
caught by this method. The percentage gives information on how often this exception is being
thrown in relation to all the detected thrown exceptions.
120 Using Visualizer Functions