
HPjmeter 4.2 User's Guide
Monitor Memory and/or Heap Activity Menu (page 122)
• Heap Monitor (page 122)
• Garbage Collections (page 123)
• GC Duration (page 124)
• Percentage of Time Spent in Garbage Collection (page 125)
• Unfinalized Objects (page 126)
• Allocated Object Statistics by Class (page 127)
• Allocating Method Statistics (page 128)
• Current Live Heap Objects (page 129)
Monitor Threads and/or Locks Menu (page 131)
• Thread Histogram (page 131)
• Lock Contention (page 133)
Monitor JVM and/or System Activity Menu (page 134)
• Method Compilation Count (page 134)
• Method Compilation Frequency (page 135)
• Percent (%) CPU Utilization (page 136)
• Loaded Classes (page 135)
See also:
• Monitoring Applications (page 36)
• Using the Console (page 93)
• Using Visualizer Tool Bars (page 176)
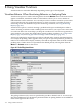
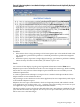
Monitor Code and/or CPU Activity Menu
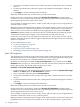
Java Method HotSpots
Displays a sampling-based estimate of the CPU time consumed by individual Java methods.
Methods are listed from highest to lowest CPU usage by percentage; over a session lifetime; with
package, method, and method arguments displayed.
Each method's information is written over a graphical representation of the confidence interval
calculated for that method.
118 Using Visualizer Functions