
HPjmeter 4.2 User's Guide
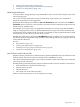
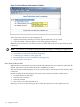
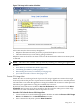
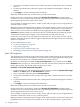
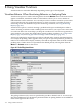
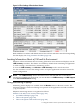
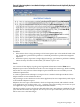

Figure 8-2 The Garbage Collection Data Viewer
Both standalone visualizers and tabbed viewers have tool bars and other controls for manipulating
the data display. See Using Visualizer Tool Bars (page 176).
Locating Information About a JVM and its Environment
HPjmeter collects information about a running JVM and its environment and displays it in the
JVM Summary visualizer. This feature is available by default when monitoring an application
or when viewing a saved file from a monitoring session.
To view the JVM Summary, click Monitor→JVM Summary on the console menu bar.
Use this visualizer to review the settings used to set up the application run and to review the
system configuration.
NOTE: The JVM Summary obtains information from collected JMX data. To disable the
transmission of JMX data from the JVM, you must disable both JVM Summary and JMX Support
in the Session Preferences dialog.
Using Monitoring Displays
Monitoring metric displays are available from the Monitor menu on the main console. The
monitoring displays can be used during live operation of the application and with saved data
(.hpjmeter) files.
HPjmeter monitoring metrics are organized as follows:
Monitor Code and/or CPU Activity Menu (page 118)
• Java Method HotSpots (page 118)
• Thrown Exceptions (page 120)
• Thrown Exceptions with Stack Traces (page 120)
Locating Information About a JVM and its Environment 117