
HPjmeter 4.2 User's Guide
300% of 1 CPU out of a total of 4 available CPU. By applying this value (300%) for a 5–minute
duration in the Alert Controller, HPjmeter notifies you each time that value is exceeded for 5
minutes during the monitoring session. A notification is generated for display on the console
and recorded in the alert log.
Conversely, if you expect that your application will always use at least 100% of 1 CPU, set the
operator at less than or equal to 100% to trigger a notification that the application is not consuming
resources as expected.
For more information, see also:
• Set Session Preferences (page 26)
• Using Alerts (page 103)
• Percent (%) CPU Utilization (page 136)
• Identifying Unexpected CPU Usage by Method (page 39)
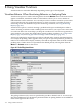
Thread Deadlock Alert
By default, this alert is activated when two or more threads are attempting to acquire Java locks
that have been acquired already by a set of threads.
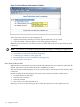
Double-click the alert to display the thread histogram window. This allows you to determine
which threads are deadlocked.
Deadlocked threads represent a multi-threaded program error.
An application experiencing a deadlock may not crash, but it is unresponsive to requests.
If the alert persists, it suggests a problem in the application logic that will need to be addressed
by developers.
See also:
• Thread Histogram (page 131)
• Lock Contention (page 133)
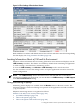
Unfinalized Queue Growth
This alert activates when the average finalizer queue length in a 5–minute period exceeds the
value set in the Alert Controller. The default setting for this alert is 5000 objects.
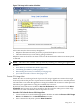
Double-click the alert in the console to open the Unfinalized Queue Growth visualizer.
See Unfinalized Objects (page 126) for information on how to interpret the data presented in this
visualizer.
Using Alerts 115