
HPjmeter 4.2 User's Guide
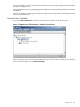
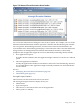

The window shows events in a hierarchical tree.
• Select the View→Show Packages menu item to alternatively hide or show the Java package
names to shorten the lines in the display.
• Select the View→Show Stacktraces menu item to alternatively expand or collapse the
thrown stack traces of all the exception nodes, or click on a specific node to expand or collapse
its thrown stack trace only.
The results are cumulative over the life time of the session.
See also:
• Thread Histogram (page 131)
• Identifying Abnormal Thread Termination (page 44)
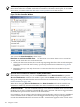
Excessive Compilation Alert
By default, HPjmeter detects when one method (or more) is repeatedly compiled.
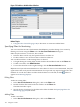
Double-click on the Excessive Compilation alert to display the metrics for excessive method
compilation.
See also: Identifying Excessive Method Compilation (page 46) .
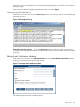
Expected Out Of Memory Error Alert
HPjmeter detects memory leaks automatically and reports an alert before a crash occurs. By
default, this alert activates when memory use increases by a rate of 10 MB/hr.
Double-click on the alert to open the Heap Monitor display.
The heuristic algorithms for alert triggers are tuned for server-oriented applications. The alerts
are based on heuristic algorithms and are not offered with 100 percent certainty. Fluctuations in
the application load may cause a transient increase in memory usage.
To confirm the leak, monitor the application for one hour or longer; then review the Garbage
Collections metrics.
See also:
• Garbage Collections (page 123)
• Confirming Java Memory Leaks (page 43)
• How Memory Leak Detection Works (page 189)
• Heap Monitor (page 122)
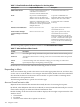
GC Duration Notification
Set this threshold when you suspect that the duration of garbage collections exceeds or is
significantly less than what is reasonable for the application heap size.
The Alert Controller displays this alert threshold differently depending on the Java version run
with the application.
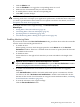
Table 7-8 GC Duration Notification Display by Java Version
Default Alert ThresholdMetric NameJava Version
> 2000 milliseconds (2 seconds)GC DurationHP 1.4.2.02 or later 1.4.x versions
> 30 secondsGC Duration (Major)HP 1.5.0.12 or 6.0.01 or later
> 2000 millisecondsGC Duration (Minor)HP 1.5.0.12 or 6.0.01 or later
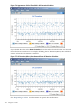
Double-click on the alert to display the GC Duration Notification visualizer.
See also:
• GC Duration (page 124)
• Heap Monitor (page 122)
110 Using the Console