
HPjmeter 4.2 User's Guide
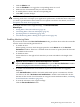
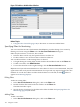
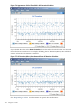
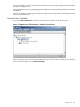
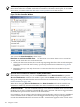
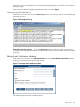
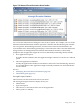

Figure 7-12 Abnormal Thread Termination Alert Visualizer
You can use this information to debug the cause of the exception. For example, each row in the
Abnormal Thread Termination window represents a thread in the Thread Histogram window.
You can open the Thread Histogram metric, and notice that when a thread terminates, the
associated bar in the Thread Histogram display is shorter than the others. Note that the thread
histogram does not distinguish between threads that terminate normally or abnormally.
Symptoms that an application might show if it has abnormally terminating threads include:
• Poor application response.
If worker threads terminate, then the application might continue to work, but at a reduced
speed.
• The entire application terminates.
Usually the application itself does not terminate as the result of one thread dying. However,
it is possible that the entire application might eventually terminate if it cannot handle the
loss of a thread.
See also:
• Identifying Abnormal Thread Termination (page 44)
• Thread Histogram (page 131)
Uncaught Exception Statistics
These statistics are derived from more than one metric.
The Uncaught Exception Statistics display shows you:
• Thread name
• Type of Exception
• Time thrown, as the time from the start of the application
• Throw point as a subentry
Using Alerts 109