
HPjmeter 4.2 User's Guide
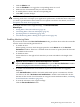
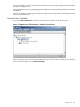
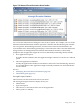

2. Click Add Filter Set.
The Filter Set Editor opens.
3. Type the name of the filter set in the Filter Name field.
4. Specify the list of packages for the filter in the Filter Set field. See Specifying Filters for
Monitoring (page 102) for details.
Specifying Filter Sets
Filter sets are comma-separated lists of packages, classes, or both. You can use wildcards or
periods at the end of the name only, but they are not necessary. For example, the following are
permitted:
• javax.swing.*
• com.foo.bar.
• mypackage.MyClass
Names such as *.util and com.*.util are not valid.
Related Topic
• See include/exclude options in JVM Agent Options (page 17)
Viewing Monitoring Data in HPjmeter
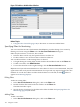
Once you have started the data collection by opening a session in the console pane, you are ready
to view monitoring metrics.
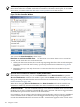
• Click the time slice that you want to view. This will activate the Monitor menu selections.
• Click the Monitor heading to see the list of monitoring categories. Mouse over each category
to see the available metrics.
NOTE: A grayed-out menu item indicates that data is not currently available for viewing.
• Click the metric that you want to view.
The data for that metric will open in a separate, standalone visualizer that can be moved to
any location on your monitor screen.
• Use the visualizer buttons and other functions to manipulate the data in the visualizer.
See also
• Using Visualizer Functions (page 116)
• Using Monitoring Displays (page 117)
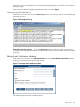
Using Alerts
The console provides a way for you to enable and disable alerts for specific events when
monitoring an application. Enabled alerts can be deactivated and reactivated during the session
as needed by using the Alert Contr oller. In addition, you can set thresholds in the Alert Controller
to vary the sensitivity of the console to enabled alert conditions, and you can edit e-mail
notification attributes submitted when you set session preferences.
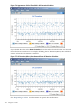
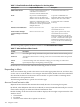
When active alerts are triggered, a notification appears in the main pane of the console window,
and the alert type and threshold value are displayed on all relevant metric visualizers. To view
details about the application behavior that triggered the notification, double-click on the specific
alert that you want to see. A metric window associated with the alert will open, with the alert
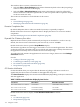
type and its threshold value displayed at the bottom of the window. For example, if you enabled
GC Duration (Major) and GC Duration (Minor) alerts, and the alerts were triggered, the GC
Duration visualizer might look something like this:
Viewing Monitoring Data in HPjmeter 103