
HPjmeter 4.2 User's Guide
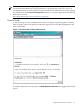

Status Bar
The Status Bar in the lower bottom and right corner of the console provides standard notifications
including:
• status and error messages
• warning icon when an alert is present
• memory use by the console (mousing over the horizontal bar reveals percent memory use
of total allocated MB)
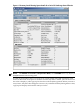
Setting Monitoring Session Preferences
The Session Preferences dialog box allows you to:
• Specify which monitoring metrics to collect.
• Enable or disable specific alerts.
• Control filters you can use to specify the information to collect.
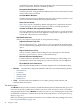
Specifying Metrics to Collect for Monitoring
You can open the Session Preferences window at any time by double-clicking on an Open Session,
or single-clicking on it then clicking the Session Preferences toolbar button.
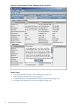
In pre-deployment or development, it is typical to enable all items. In deployment mode, when
you may be concerned about the impact on the application, you can enable a subset of the available
items. For more information about performance, see Performance Overhead on Running
Applications (page 187).
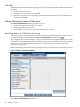
Reduce monitoring overhead by turning off metrics that you don't need for a monitoring session.
Figure 7-4 Metric Preferences Window
In the Session Preferences dialog box:
100 Using the Console