
HPjmeter 4.2 Release Notes and Installation Guide

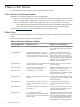
Table Of Contents
- HPjmeter 4.2 Release Notes and Installation Guide
- Table of Contents
- About This Document
- 1 Announcement
- 2 New in This Version
- 3 Known Problems and Workarounds
- 4 Compatibility Information and Installation Requirements
- Platform Support and System Requirements
- File Locations
- Installing HPjmeter on HP-UX
- Attaching to the JVM Agent of a Running Application
- Configuring HPjmeter on HP-UX
- Starting the Console On HP-UX
- Installing the Console on Linux
- Starting the Console On Linux
- Installing the Console on Microsoft Windows
- Starting the Console On Microsoft Windows
- Security Awareness
- Installation Troubleshooting
- 5 Support for users
- Glossary of Acronyms and Abbreviations
- Index

3 Known Problems and Workarounds
• The JVM agent may not be able to instrument and collect metrics for certain methods. Review
the JVM agent log file to identify the methods that were not measured. The path to the JVM
agent log file is:
/var/opt/hpjmeter/log/HPjmeter.jvmagent_pid.log
where pid is the process ID of the associated JVM agent.
The log file shows this message for non-instrumented methods:
Cannot instrument method method_name
• To minimize impact on your system, do not run the console on a machine that is a managed
node.
The console uses 256 MB of memory by default. For a long-running monitoring session, start
the console with >256 MB of Java heap.
• When using a console through remote window manager software, you may notice degraded
performance in the speed at which graphics are drawn.
For best performance, run the console on your local machine.
10 Known Problems and Workarounds