
HP XP P9000 Continuous Access Synchronous for Mainframe Systems User Guide
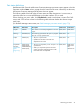
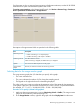

3. In the Display Item dialog box—Select Volume box, select one of the following:
• ALL Volumes, to view I/O statistics for all LDEVs in the system. When selected, the LDKC
number, CU number, and LDEV number appear above the graph.
- A device ID ending in # (such as, 00:00:3F #) indicates the LDEV is an external volume.
For more information, see the HP XP P9000 External Storage for Open and Mainframe
Systems User Guide.
- A device ID ending in X (such as, 00:00:3C X) indicates the LDEV is a Thin Provisioning
Z virtual volume. For more information, see the HP XP P9000 Provisioning for Mainframe
Systems User Guide.
• Volume, to view I/O statistics for a specific LDEV. Enter the LDKC number (00 or 01),
CU number (00-FE) and LDEV ID (00-FF) of the desired volume.
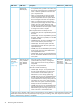
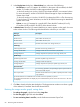
4. In Monitor Data, select the I/O statistics data that you want to appear on the graph. You must
select at least one box. The following table describes the selections you can make.
DescriptionData type
RIO Count
1
Total number of remote I/Os.All RIO Count
Total number of write I/Os.All Write Count
Number of errors that occur during remote I/O.RIO Error Count
Initial Copy
Number of initial copy remote I/Os.Initial Copy RIO Count
Average transfer rate for initial remote I/Os (kB/sec).Average Transfer Rate
Average response time (msec) for initial copy remote I/Os.Average Response
Update Copy
Number of update copy remote I/Os.Update Copy RIO Count
Average transfer rate (kB/sec).Average Transfer Rate
Average response time (msec) for update copy remote I/Os.Average Response
Synchronization
2
For initial copy operations, the percentage of pairs synchronized out
of the total number of pairs.
Pair Synchronized
Number of tracks that have not yet been copied by the initial or resync
copy operation.
Out of Sync Tracks
(1) The RIO statistics are included for Cnt Ac-S and Cnt Ac-S Z operations, if present.
(2) Synchronization data does not display for pairs created with the previous version of Cnt Ac-S Z. In this case
“0” displays.
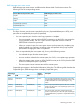
5. Click Set to close the Display Item dialog box. The Usage Monitor window now shows a graph
of the selected I/O statistics data for the selected LDEVs.
Resizing the usage monitor graph, saving data
• To enlarge the graph, right-click and select Large Size.
• To close the graph, right-click and select Close.
• To save monitoring data in text files, use the Performance Monitor Export Tool.
80 Monitoring and maintenance