
HP XP P9000 Continuous Access Synchronous for Mainframe Systems User Guide

For information on how to start and stop monitoring in Performance Monitor, see the HP XP P9000
Performance for Open and Mainframe Systems User Guide.
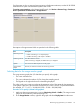
To monitor copy operations, in the Remote Web Console, click Actions > Remote Copy > Continuous
Access Synchronous for Mainframe > Usage Monitor.
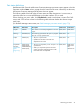
Descriptions of Usage Monitor fields are provided in the following table.
DescriptionItem
Monitoring Switch
• Enable: Monitoring is on. Graph displays.
• Disable: Monitoring is off. Graph is disabled.
The data collection interval.Gathering Interval
When monitoring is stopped, the default value (1) is displayed.
The most recent data sample time on the graph.Update
Remote I/O statistics and status of remote copy monitor.Usage Monitor
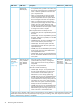
Graph
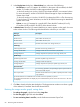
Selecting data for the usage monitor graph
The usage monitor graph plots I/O data that you specify. In the graph:
• The x-axis indicates time.
• The y-axis indicates the number of I/Os during the sampling period.
• The legend on the right side shows the data being displayed.
The value on the y-axis varies according to the maximum value of the statistical data appearing
in the graph. If the y-axis value exceeds 10,000,000, the value is shown in exponential notation
(for example, 1E7 = 1×107 = 10,000,000; 2E8 = 2×108 = 200,000,000).
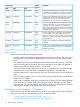
Procedure 14 To specify I/O data to be graphed:
1. Make sure that usage monitoring is running (Monitoring Switch = Enable). The usage monitor
graph can be viewed only when monitoring is on.
2. In the Usage Monitor window, right-click the graph and select Display Item from the menu.
Monitoring copy operations, I/O statistics 79