
HP P9000 Performance for Open and Mainframe Systems User Guide (AV400-96395, October 2011)


Selecting of monitoring objects
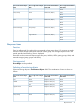
Select monitoring objects in Performance Objects: field. The combination of items is shown as
follows.
Item on right side of Monitor
Data: field
Item on left side of Monitor
Data: field
Item on right side of Object:
field
Item on left side of Object:
field
TotalBack Trans. (count/sec)NoneLogical Device
Cache to Drive
Drive to Cache (Sequential)
Drive to Cache (Random)
TotalBack Trans. (count/sec)NoneParity Group
Cache to Drive
Drive to Cache (Sequential)
Drive to Cache (Random)
TotalBack Trans. (count/sec)NoneLUN
Cache to Drive
Drive to Cache (Sequential)
Drive to Cache (Random)
Hard disk drive usage statistics
Function
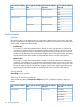
The usage rates of the hard disk drive of each LDEV or parity group can be displayed.
Storing period
Short-Range can be specified.
Selecting of monitoring objects
Select monitoring objects in Performance Objects: field. The combination of items is shown as
follows.
Item on right side of Monitor
Data: field
Item on left side of Monitor
Data: field
Item on right side of Object:
field
Item on left side of Object:
field
NoneDrive Usage Rate (%)NoneLogical Device*
NoneDrive Usage Rate (%)NoneParity Group*
* Only information about internal volumes is displayed. Information about external volumes and
FICON DM volumes is not displayed.
Hard disk drive access rates
Function
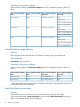
The hard disk drive access rate shows the access rate of each hard disk drive (HDD).
The rate of the file reading Read (Sequential) or the file writing Write (Sequential) processing of
HDD in the sequential access mode is displayed.
34 Working with graphs