
HP P9000 Performance for Open and Mainframe Systems User Guide (AV400-96395, October 2011)


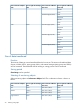

If the monitor data shows high DRR usage overall, this can indicate high write penalty condition.
Please consult your HP representative about high write penalty conditions.
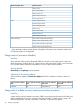
Storing period
Short-Range or Long-Range can be specified.
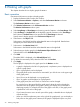
Selecting of monitoring objects
Select monitoring objects in Performance Objects: field. The combination of items is shown as
follows.
Item on right side of Monitor
Data: field
Item on left side of Monitor
Data: field
Item on right side of Object:
field
Item on left side of Object:
field
NoneUsage Rate (%)DRRController
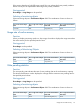
Usage rate of cache memory
Function
When you display monitoring results in a short range, the window displays the usage rates about
the cache memory for the specified period of time.
Storing period
Short-Range can be specified.
Selecting of Monitoring Objects
Select monitoring objects in Performance Objects: field. The combination of items is shown as
follows.
Item on right side of Monitor
Data: field
Item on left side of Monitor
Data: field
Item on right side of Object:
field
Item on left side of Object:
field
NoneUsage Rate (%)NoneCache
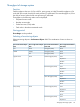
Write pending statistics
Function
The write pending rate indicates the ratio of write pending data to the cache memory capacity.
The Monitor Performance window displays the average and the maximum write pending rate for
the specified period of time.
Storing period
Short-Range or Long-Range can be specified.
Selecting of monitoring objects
Select monitoring objects in Performance Objects: field. The combination of items is shown as
follows.
Item on right side of Monitor
Data: field
Item on left side of Monitor
Data: field
Item on right side of Object:
field
Item on left side of Object:
field
NoneWrite Pending Rate (%)NoneCache
Usage rate of cache memory 27