
HP P9000 Performance for Open and Mainframe Systems User Guide (AV400-96395, October 2011)
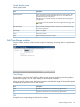
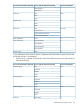

DescriptionItem
ID of the monitoring object.Object ID
Remove the object in this table.Remove
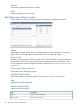
OK
Displays the graph.
Cancel
Cancels this operation and closes this window.
Help
Opens the help topic for this window.
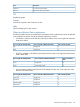
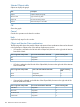
Object and Monitor Data combinations
The following table shows the possible Object and Monitor Data combinations that can be selected
in the Performance Objects area of the Monitor Performance window.
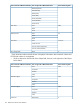
• If Controller is selected on the left side of the Object field, the item on the right side of Monitor
Data field is blank.
Unit of monitoring dataItem on left side of Monitor Data fieldItem on right side of Object field
%Usage RateMP
%Usage RateDRR
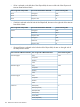
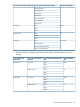
• If Cache is selected on the left side of the Object field, the item on the right side of the Monitor
Data is blank field.
Unit of monitoring
data
Item on left side of Monitor Data fieldItem on right side of Object field
%Usage RateNone
%Write Pending RateNone
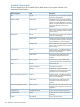
• If Access Path is selected on the left side of the Object field, the item on the right side of the
Monitor Data field is blank.
Unit of monitoring dataItem on left side of Monitor Data fieldItem on right side of Object field
%Usage RateCHA ESW
%Usage RateDKA ESW
%Usage RateMP Blade ESW
%Usage RateCache ESW
Edit Performance Objects window 133