
HP P9000 Performance for Open and Mainframe Systems User Guide (AV400-96395, October 2011)
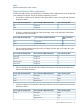
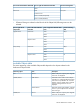

Unit of monitoring dataItem on right side of Monitor Data fieldItem on left side of Monitor Data field
%NoneDrive Usage Rate*
%Read (Sequential)Drive Access Rate*
Read (Random)
Write (Sequential)
Write (Random)
%NoneBusiness Copy*
* Only information about internal volumes is displayed. Information about external volumes and
FICON DM volumes is not displayed.
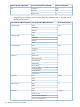
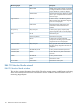
• If Parity Group is selected on the left side of the Object field, the item on the right side of the
Object field is blank.
Unit of monitoring dataItem on right side of Monitor Data fieldItem on left side of Monitor Data field
IOPSTotalTotal Throughput
Sequential
Random
CFW
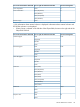
IOPSTotalRead Throughput
Sequential
Random
CFW
IOPSTotalWrite Throughput
Sequential
Random
CFW
%Read (Total)Cache Hit
Read (Sequential)
Read (Random)
Read (CFW)
Write (Total)
Write (Sequential)
Write (Random)
Write (CFW)
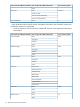
MB/sTotalData Trans.
Read
Write
msTotalResponse Time
Read
Monitor Performance window 113