HP P9000 Performance for Open and Mainframe Systems User Guide Abstract This guide describes and provides instructions for using HP P9000 Performance Monitor Software and HP P9000 Cache Residency Manager Software to configure and perform operations on HP P9000 disk arrays. The intended audience is a storage system administrator or authorized service provider with independent knowledge of HP P9000 disk arrays and the HP Remote Web Console.
© Copyright 2010, 2011 Hewlett-Packard Development Company, L.P. Confidential computer software. Valid license from HP required for possession, use or copying. Consistent with FAR 12.211 and 12.212, Commercial Computer Software, Computer Software Documentation, and Technical Data for Commercial Items are licensed to the U.S. Government under vendor's standard commercial license. The information contained herein is subject to change without notice.
Contents 1 Performance improvement of storage system...................................................7 Performance Monitor ................................................................................................................7 Cache Residency .....................................................................................................................7 2 About monitoring performance.....................................................................8 Monitoring resource availability ...
Back-end performance ............................................................................................................33 Hard disk drive usage statistics ................................................................................................34 Hard disk drive access rates ....................................................................................................34 Business Copy usage statistics .....................................................................................
Processing time ............................................................................................................61 Termination code .........................................................................................................62 Log files ......................................................................................................................62 Error handling .............................................................................................................
Confirm window..............................................................................................................117 View CU Matrix window.......................................................................................................118 Select by Parity Groups window.............................................................................................120 Parity Group Properties window..............................................................................................
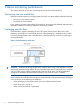
1 Performance improvement of storage system Unless otherwise specified, the term P9000 in this guide refers to the following disk array: • P9500 Disk Array The GUI illustrations in this guide were created using a Windows computer with the Internet Explorer browser. Actual windows may differ depending on the operating system and browser used. GUI contents also vary with licensed program products, storage system models, and firmware versions.
2 About monitoring performance This chapter provides an overview of Performance Monitor and Cache Residency. Monitoring resource availability Performance Monitor tracks your storage system so that you can obtain statistics about the following: • Resources in your storage system • Workloads on disk and ports If your system encounters some problem (for example, if server hosts suffer delayed response times), Performance Monitor can help you detect the cause of the problem.
NOTE: Notes of Cache Residency show as follows: • If you have accessed the Cache Residency area for input and output before the prestaging operation is performed from the SVP or Remote Web Console, the host may not be able to find data in the cache at the first I/O access after Cache Residency is configured. • In order to prevent the response time of host I/O being slow, the prestaging operation may be interrupted when the cache load is heavy.
is duplexed in the Cache Residency area, which consumes a significant amount of the Cache Residency cache. In Bind Mode, the total capacity of cache required is: standard cache + Cache Residency cache The following table specifies the cache requirements for bind mode operations. For further information on calculating procedures for required cache size for using Cache Residency if the bind mode is set, see “Estimating cache size ” (page 38).
Changing the mode without cache extension requires reconfiguring of Cache Residency (i.e., release the data from cache, and then place the data back in cache with the desired mode).
3 Interoperability of Performance Monitor and other products This chapter describes the interoperability of Performance Monitor and other products. Maintenance If the storage system is undergoing following maintenance operations during monitoring, the monitoring data might contain extremely large values. • Adding on, replacing, or removing cache memories. • Adding on, replacing, or removing disk drives. • Changing the system configuration. • Replacing the micro program.
◦ Changing the system configuration. ◦ Replacing the micro program. Viewing the WWN monitoring data To start monitoring traffic between host bus adapters and storage system ports, you must make settings before starting monitoring. For details, see topics between “Displaying WWNs to be monitored ” (page 17) and “Deleting WWNs from monitoring target objects ” (page 19).
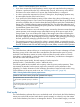
Figure 3 Graph 2: I/O rate displayed in Performance Monitor (the Detail check box is not selected) Figure 4 Graph 3: I/O rate displayed in Performance Monitor (the Detail check box is selected) • Note on using Continuous Access Synchronous: Performance Control monitors write I/O requests issued from initiator ports of your storage system.
4 Monitoring CUs This chapter describes how to set up CUs to be monitored. Displaying CUs to be monitored Use the Performance Monitor window to display the list of CUs to be monitored. 1. In the Remote Web Console main window. 2. Select Performance Monitor in Explorer, and select Performance Monitor in the tree. The Performance Monitor window opens. 3. Select the Monitored CUs tab. CUs to be monitored are listed in the tab.
7. After confirming the property of the parity group, click Close. The Select by Parity Groups window opens. 8. Select the parity group to be monitoring target in the Select by Parity Groups window, click OK. CUs in the parity group are selected in the Unmonitored CUs field. To monitor these CU, see “Adding or removing CUs to be monitored ” (page 15). Confirming the status of CUs to be monitored Use the View CU Matrix window to display statuses of CUs edited in the Edit Monitoring CUs window. 1.
5 Monitoring WWNs This chapter describes how to set up WWNs to be monitored. Displaying WWNs to be monitored Use the Performance Monitor window to display the list of WWNs to be monitored. 1. Display the Remote Web Console main window. 2. Select Performance Monitor in Explorer, and select Performance Monitor in the tree. The Performance Monitor window opens. 3. Select the Monitored WWNs tab. WWNs to be monitored are listed in the tab.
Specify three values of a WWN. • HBA WWN The hexadecimal number of 16 digits. • WWN Name The nickname to distinguish the host bus adapter from others. WWN Name is less than 64 digits and consist of alphanumeric characters and a portion of characters of symbol. • The list of ports in Available Ports The target ports list. However, the ports of the mainframe system are not displayed in the list because they are not supported for Performance Monitor. 6.
5. Select a port to connect in Available Ports, and then click Add. However, the ports of the mainframe system are not displayed in the list because they are not supported for Performance Monitor. The added WWN and the port are specified for the Selected WWNs. 6. If necessary, select unnecessary row of a WWN and port in Selected WWNs, and then click Deselect. WWNs are deleted. 7. 8. Click Finish. Click Apply. The settings that you have made are registered in the system.
6 Monitoring operation This chapter describes how to start and stop the monitoring operation. Performing Monitoring Operation This topic describes how to start or stop the monitoring operation. • To start the monitoring operation, see “Starting monitoring ” (page 20). • To stop the monitoring operation, see “Stopping monitoring ” (page 20). Starting monitoring To start monitoring the storage system, start Performance Monitor and open the Edit Monitoring Switch window. 1.
5. 6. Click Finish. Click Apply to stop monitoring.
7 Setting statistical storage ranges This chapter describes statistical storage ranges. About statistical storage ranges Performance Monitor collects and stores statistics for two time periods (ranges): short range and long range. The difference between the two ranges and the statistics they target are as follows: • Short range If the number of CUs to be monitored is 64 or less, statistics are collected at a user-specified interval between 1 and 15 minutes, and stored between 1 and 15 days.
5. Select Set Range or Use Real Time in the Time Range as the periods (ranges) for displaying statistics. If Long-Range is selected, you can specify only Set Range. If Short-Range is selected, you can select Set Range or Use Real Time. Performance Monitor saves the statistics obtained up to 1440 times in SVP. Therefore, you can estimate the storing period of statistics with "gathering interval multiplied by 1440".
8 Working with graphs This chapter describes how to display graphs of statistics. Basic operation Use Monitor Performance window to display graphs. 1. Display the Remote Web Console main window. 2. Select Performance Monitor in Explorer, and select Performance Monitor in the tree. The Performance Monitor window opens. 3. Click Monitor Performance in the Performance Monitor window. The Monitor Performance window opens. 4. 5.
on X axis, the graph is always displayed on the screen. Therefore, the graph cannot be displayed by clicking the explanatory note. 12. To close the graph, click Delete Graph. Objects that can be displayed in graphs Set items to display graph in the Performance Objects: field of the Monitor Performance window. The outline of target objects and monitoring data that can be displayed in graphs is shown as follows: Monitoring target object Monitoring data Controller Usage rates of processor blade (%).
Monitoring target object Monitoring data Cache hit (%). Data transfer (MB/s). Response time (ms). Back transfer (count/sec). Drive usage rate (%).* LUN Total throughput (IOPS). Read throughput (IOPS). Write throughput (IOPS). Cache hit (%). Data transfer (MB/s). Response time (ms). Back transfer (count/sec). External Storage Data transfer of logical devices (MB/s). Response time of logical devices (ms). Data transfer of parity groups (MB/s). Response time of parity groups (ms).
If the monitor data shows high DRR usage overall, this can indicate high write penalty condition. Please consult your HP representative about high write penalty conditions. Storing period Short-Range or Long-Range can be specified. Selecting of monitoring objects Select monitoring objects in Performance Objects: field. The combination of items is shown as follows.
Access paths usage statistics Function An access path is a path through which data and commands are transferred within a storage system. In a storage system, channel adapters control data transfer between hosts and the cache memory. Disk adapters control data transfer between the cache memory and hard disk drives. Data transfer does not occur between channel adapters and disk adapters. Data is transferred via the ESW (PCI Express Switch adapter) to the cache memory.
Throughput of storage system Function Total throughput is the sum of I/Os to LDEVs, parity groups or LUNs The read throughput is I/Os to the disk per second when the file read processing is performed. The write throughput is I/Os to the disk per second when the file write processing is performed. Throughputs in the following modes can be displayed.
Item on left side of Object: field Item on right side of Object: Item on left side of Monitor field Data: field Item on right side of Monitor Data: field Random CFW Write Throughput (IOPS) Total Sequential Random CFW LUN None Total Throughput (IOPS) Total Sequential Random CFW Read Throughput (IOPS) Total Sequential Random CFW Write Throughput (IOPS) Total Sequential Random CFW Size of data transferred Function The amount of data per second transferred from the host server.
Item on left side of Object: field Item on right side of Object: Item on left side of Monitor field Data: field Item on right side of Monitor Data: field Write Parity Group None Data Trans. (MB/s) Total Read Write LUN None Data Trans. (MB/s) Total Read Write External Storage Parity Group Data Trans. (MB/s) Total Read Write Logical Device Data Trans.
Item on left side of Object: field Item on right side of Object: Item on left side of Monitor field Data: field Item on right side of Monitor Data: field LUN None Total Response Time (ms) Read Write External Storage Parity Group Response Time (ms) Total Read Write Logical Device Response Time (ms) Total Read Write Cache hit rates Function The cache hit rate is a rate that the input or output data of the disk exists in the cache.
Item on left side of Object: field Item on right side of Object: Item on left side of Monitor field Data: field Item on right side of Monitor Data: field Write (Sequential) Write (Random) Write (CFW) Parity Group None Cache Hit (%) Read (Total) Read (Sequential) Read (Random) Read (CFW) Write (Total) Write (Sequential) Write (Random) Write (CFW) LUN None Cache Hit (%) Read (Total) Read (Sequential) Read (Random) Read (CFW) Write (Total) Write (Sequential) Write (Random) Write (CFW) Back-end perfo
Selecting of monitoring objects Select monitoring objects in Performance Objects: field. The combination of items is shown as follows. Item on left side of Object: field Item on right side of Object: Item on left side of Monitor field Data: field Item on right side of Monitor Data: field Logical Device None Total Back Trans. (count/sec) Cache to Drive Drive to Cache (Sequential) Drive to Cache (Random) Parity Group None Back Trans.
The rate of file reading Read (Random) or file writing Write (Random) processing of HDD in the random access mode is displayed. Storing period Long-Range or Short-Range can be specified. Selecting of monitoring objects Select monitoring objects in Performance Objects: field. The combination of items is shown as follows.
9 Changing display of graphs This chapter describes how to change displaying of graphs. Graph operation Information displayed in the graph can be changed. The following operations can be performed. • Displayed items in the graph can be changed For details, see “Changing displayed items ” (page 36). • Displayed periods in the graph can be changed For details, see “Changing a display period ” (page 36). • Add new graph For details, see “Adding a new graph ” (page 36).
1. Display graph in the Monitor Performance window. For details, see “Basic operation ” (page 24). 2. Click Add Graph. The Add Graph window opens. 3. Change displayed items in the information setting field at the left of the window. For details, see “Basic operation ” (page 24). 4. Click Add. Items are added in the Selected Objects field. 5. 6. If you want to delete the item, select the item and then click Deselect. Click OK. The graph is added.
10 Estimating cache size This chapter describes how to estimate the cache size required for using Cache Residency. About cache size The required cache size for using Cache Residency differs according to operation modes or RAID levels. For example, if the bind mode is set, RAID1 storage systems require twice the size of cache for the user data to use Cache Residency. However, RAID5 or RAID6 storage systems require three times the size of cache.
Calculating cache size for open systems 1. Calculate the converted values of the starting address and the ending address. For all specified LDEVs: 1. For OPEN-V: Number of LBAs = LDEV size (KB)×2 Convert the LDEV size to the number of LBAs. Number of slots = ceil (Number of LBA ÷ 512) Round up the value that is calculated from the formula enclosed by ceil(). Converted value of starting address = 0 Converted value of ending address = (Number of slots × 512) - 1 2.
1. For OPEN-V: Number of addresses = Converted value of ending address - Converted value of starting address + 1 Calculate the number of LBAs that are used by the user data. 2. For emulation types other than OPEN-V: Number of LBAs = Converted value of ending address - Converted value of starting address + 1 Calculate the number of LBAs that are used by the user data. Number of slots = Number of LBAs ÷96 Convert the number of LBAs to the number of slots.
Calculating cache size for mainframe systems 1. Calculate the converted values of the starting address and the ending address. a. For all specified LDEVs: Setting value of ending address (CC) = floor (((LDEV size × 15) - 1) ÷ 15) Round down the value that is calculated from the formula enclosed by floor(). "Setting value of ending address (CC)" is the value which is input on the Cache Residency window.
• For mainframe volumes, each Cache Residency cache extent must be defined on contiguous tracks, with a minimum size of one cache slot (or track) and a maximum size of one LVI. This is equivalent to 66 KB. • For OPEN-V volumes, Cache Residency cache extents must be defined in logical blocks using logical block addresses (LBAs), with a minimum size of 512 LBAs (equivalent to 264 KB). However, in most cases you will assign an entire open-system volume for Cache Residency.
11 Managing resident cache This chapter provides information and instructions for using Cache Residency software to manage resident cache. Cache Residency rules, restrictions, and guidelines Rules • Cache Residency must be enabled on Remote Web Console. • Administrator or Cache Residency write access to the Remote Web Console software is required to perform Cache Residency operations.
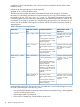
The following operations automatically reset Cache Residency cache: ◦ When LDEVs that is partly or wholly assigned to Cache Residency is deleted. ◦ When the parity group containing LDEVs that are assigned to Cache Residency is deleted. Figure 6 Example of LBA Value Setting When Using LUSE Restrictions • The Cache Residency bind mode is not available to external volumes whose Cache mode is set to Disable (which is the mode that disables the use of the cache when there is an I/O request from the host).
Launching Cache Residency 1. 2. 3. Log on to the primary SVP. When you successfully log on to the primary SVP, the Remote Web Console main window opens. On the menu bar of the Remote Web Console main window, click Actions→Other function→Cache Residency. In the Cache Residency window, click modify mode. . Change the mode between the view mode and Viewing Cache Residency information The Cache Residency information can be viewed in the following fields in the Cache Residency window.
NOTE: For OPEN-V LUs, Cache Residency identifies a logical area in units of 512 blocks. If you enter 0 or 1 as the starting LBA and a value less than 511 as the ending LBA, Cache Residency automatically changes the ending block address to 511. 4. In the Cache Residency window, select options to apply to all selected LDEVs: 1. In the Cache Residency Manager Mode box, select the desired mode (Bind or Priority). 2. Select the desired Prestaging Mode setting (Yes or No).
8. 9. To start the operation(s), click Apply. If Prestaging was selected, respond to the Yes/No confirmation. To continue with prestaging, click Yes. To continue without it, click No. Monitor the Cache Residency window to make sure that the operation(s) complete successfully. The cache information area shows the progress of the requested operation(s). Placing LDEV(s) into Cache Residency cache This procedure places ALL data on one or more LDEVs into Cache Residency cache. 1.
1. 2. In the Cache Residency window, select the desired CLPR from the CLPR list. In the CU:LDEV tree, select the LDKC and the CU containing the desired LDEV, and then select the desired LDEV. The LDEV information table shows the information for the selected LDEV. The Mode column indicates Prio or Bind for each data area that is allocated to Cache Residency cache. 3. 4. Select the data area(s) that you want to release from Cache Residency cache. This enables the Release.
1. Check the Multi Set / Release box, click Release, and then click OK on the confirmation message. 2. In the Multi Release dialog box, select the desired LDKC and CU image, and select the desired LDEV(s) to release from Cache Residency cache. Click Release to return to the Cache Residency window. The requested Cache Residency operations appear in blue in the LDEV information table. 3. 4. Repeat steps (2) and (3) until all desired operations are listed. NOTE: 5. 6. 7.
12 Troubleshooting This chapter provides references to sources of troubleshooting information and contact information for HP Technical Support. Troubleshooting For troubleshooting information on the P9500, see the HP P9000 Owner Guide. For troubleshooting information on the Remote Web Console software, see the HP P9000 Remote Web Console User Guide. For information on Remote Web Console error codes, see the HP P9000 Remote Web Console Messages.
13 Support and other resources Contacting HP For worldwide technical support information, see the HP support website: http://www.hp.
HP websites For additional information, see the following HP websites: • http://www.hp.com • http://www.hp.com/go/storage • http://www.hp.com/service_locator • http://www.hp.com/support/manuals • http://www.hp.com/support/downloads • http://www.hp.
Table 3 Document conventions (continued) Convention Element Monospace text • File and directory names • System output • Code • Commands, their arguments, and argument values Monospace, italic text • Code variables • Command variables Monospace, bold text WARNING! CAUTION: IMPORTANT: NOTE: TIP: Emphasized monospace text Indicates that failure to follow directions could result in bodily harm or death. Indicates that failure to follow directions could result in damage to equipment or data.
A Export Tool This chapter explains how to use the Export Tool to export into files the monitoring data collected on your storage system. About the Export Tool Use the Export Tool to export the monitoring data (statistics) shown in the Monitor Performance window to text files. You can also use the Export Tool to export monitoring data on remote copy operations performed by Continuous Access Synchronous, Continuous Access Synchronous Z, Continuous Access Journal, and Continuous Access Journal Z.
4. Change the directory to the created directory. #cd /monitor 5. Copy the CD-ROM to the created directory. For HP-UX system: # cp/ /program/monitor/HP_UX/export.tar For Solaris: # cp/ /program/monitor/solaris/export.tar For Linux: # cp/ /program/monitor/HP_UX/export.tar 6. Execute the program file. # tar xvf export.
The JRE version required for running the Export Tool is the same as the JRE version required for running Remote Web Console. ◦ A user ID for exclusive use of the Export Tool To use the Export Tool, you must create a user ID exclusively for the Export Tool. HP recommends that you assign only the Storage Administrator (Performance Management) role to the user ID for the Export Tool to manage the storage system.
4. Decompress export.tar on your computer. The Export Tool is installed. Also, a new directory named export is created. NOTE: Consider the following: • The export directory contains several files including runWin.bat. We recommend that you delete runWin.bat because this file is no longer needed. • The Export Tool program is a Java class file and is located in the export/lib directory. Using the Export Tool To be able to export monitoring data, you must prepare a command file and a batch file.
• show The show subcommand checks SVP to find the period of monitoring data stored in SVP and the data collection interval (called gathering interval in Performance Monitor), and then outputs them to the standard output (for example, the command prompt) and the log file. Performance Monitor collects statistics by the two types of storing periods: in short range and in long range. The show subcommand displays the storing periods and the gathering intervals for these two types of monitoring data.
by these operands are the monitoring data displayed in the Physical tab of the Performance Management window with selecting longrange.) Specify a term within "Long Range From XXX To XXX" which is output by the show subcommand. In the sample file in “Preparing a command file ” (page 57), the script short-range 200610010850:200610010910 specifies the term 8:50-9:10 on Oct. 1, 2006. This script is applied to the group RemoteCopy subcommand in this example.
java -classpath "./lib/JSanExport.jar;./lib/JSanRmiApiEx.jar;./lib/JSanRmiServerUx.jar" -Xmx536870912 -Dmd.command=command.txt -Dmd.logpath=log sanproject.getmondat.RJMdMain pause Example batch file for UNIX computers (runUnix.bat): #! /bin/sh java -classpath "./lib/JSanExport.jar:./lib/JSanRmiApiEx.jar:./lib/JSanRmiServerUx.jar" -Xmx536870912 -Dmd.command=command.txt -Dmd.logpath=log sanproject.getmondat.
prompt and then pressing the key. On If you are using a Windows computer, you can double-click the batch file to execute the batch file. c:\WINDOWS> cd c:\export c:\export> runWin.bat When the Export Tool starts exporting monitoring data, dots (...) are issued to the standard output (for example, the command prompt). The dots increment as export processing continues.
Table 4 Estimate of time required for exporting files (continued) Operand for the group Estimated time subcommand Remarks LDEV This estimate assumes that: 60 minutes • The Export Tool should save statistics about 8,192 volumes within a 24-hour period. • The Export Tool is used eight times. Each time the Export Tool is used, the tool obtains statistics within a 3-hour period. LU 60 minutes This estimate assumes that: • The Export Tool should save statistics about 12,288 LUs within a 24-hour period.
Error handling When an internal error occurs during export processing, the exclamation mark (!) appears to signal the error. If this happens, the Export Tool will make up to three more attempts at processing. You can change the maximum number of retries by using the retry subcommand (see “retry” (page 66)). You can change the maximum number of retries by using the retry subcommand. For detailed information about the retry subcommand, see “retry” (page 66).
Conventions The following conventions are used to explain syntax: Convention Description bold Indicates characters that you must type exactly as they are shown. italics Indicates a type of an operand. You do not need to type characters in italics exactly as they are shown. [] Indicates one or more operands that can be omitted. If two or more operands are enclosed by these square brackets and are delimited by vertical bars (|), you can select one of the operands.
Viewing the online Help for subcommands You can display the online Help to view the syntax of subcommands when you are working at the command prompt. To be able to view the online Help, you must use the help subcommand of the Export Tool (. For detailed information about how to use the help subcommand, see “help” (page 86)). Subcommand list Subcommand Function “svpip” (page 65) Specifies the IP address of SVP to be logged in. “retry” (page 66) Makes settings on retries of export processing.
svpip 158.214.127.170 retry Description This subcommand makes settings on retries of export processing. When an internal error occurs during export processing, the Export Tool stops processing and then retries export processing. By default, the Export Tool can retry processing up to three times, but you can change the maximum number of retries by using the retry subcommand. By default, the interval between one retry and the next retry is two minutes.
Operand Description Be sure to specify a user ID that should be used exclusively with the Export Tool. For detailed information, see “Requirements for using the Export Tool ” (page 55). password Specifies the password of the user. If the password includes any non-alphanumeric character, the password ID must be enclosed by double quotation marks ("). Example This example logs the user expusr into SVP whose IP address is 158.214.127.170. The password is pswd. svpip 158.214.127.
From indicates the starting time for collecting monitoring data. To indicates the ending time for collecting monitoring data. Interval indicates the interval at which the monitoring data was collected (gathering interval). For example, Interval 15min. indicates that monitoring data was collected at 15-minute intervals. group Description The group subcommand specifies the type of monitoring data that you want to export.
Table 6 Operands of the group subcommand and saved monitoring data (continued) Operand GUI operation Monitoring data saved in the file Saved ZIP file See PortWWN Select WWN from Object list in Performance Objects field in Monitor Performance window. Statistics about host bus adapters connected to ports PortWWN_dat.zip Table 13 (page 95) LU Select LUN from Object Statistics about LUs list in Performance Objects field in Monitor Performance window. LU_dat.
Table 6 Operands of the group subcommand and saved monitoring data (continued) Operand GUI operation Monitoring data saved in the file Access Journal Z window and Continuous Access Journal Z (for volumes controlled by a particular CU) Saved ZIP file See LDEVEachOfCU Select Logical Device from Object list in Performance Objects field in Monitor Performance window. Statistics about volumes in LDEV_XXXXX.
Operands Operand Description PhyPG [Short|Long] Use this operand to export statistics about parity group usage rates, which are displayed in the Monitor Performance window. When statistics are exported to a ZIP file, the file name will be PhyPG_dat.zip. For details on the statistics exported by this operand, see Table 8 (page 89). [[parity-group-id]:[parity-group-id]][…] You can use the Short or Long option to select the storing period of the monitoring data to be exported.
Operand Description ZIP file, the file name will be PhyExG_dat.zip. For details on the statistics exported by this operand, see Table 8 (page 89). When you specify variables exg-id, you can narrow the range of external volume groups whose monitoring data are to be exported. exg-id is an ID of an external volume group. The colon (:) indicates a range. For example, E1-1:E1-5 indicates external volume groups from E1-1 to E1-5.
Operand Description PhyESW[Short|Long] Use this operand when you want to export the following statistics, which are displayed in the Monitor Performance window: • Usage rates of access paths between channel adapters and cache memories • Usage rates of access paths between disk adapters and cache memories • Usage rates of access paths between processor blades and cache switches • Usage rates of access paths between cache switches and cache memories • Usage rates of cache memories • Size of the allocated c
Operand Description LDEV [[[parity-group-id| Use this operand when you want to export statistics about volumes, which are displayed in the Monitor Performance window. When statistics are exported to a ZIP file, multiple ZIP files whose names are beginning with LDEV_ will be output. For details on the statistics exported by this operand, see Table 12 (page 94).
Operand Description specify Port CL3-a:CL3-c, but you cannot specify Port CL3-c:CL3-a. If port-name is not specified, the monitoring data of all the ports will be exported. PortWWN[[port-name]:[port-name]][…] Use this operand when you want to export statistics about host bus adapters (WWNs) connected to ports, which are displayed in the Monitor Performance window. When statistics are exported in a ZIP file, the file name will be PortWWN_dat.zip.
Operand Description displayed in the Monitor Performance window. When statistics are exported in a ZIP file, the file name will be PPCGWWN_dat.zip. For details on the statistics exported by this operand, see Table 15 (page 96). When you specify variables monitor-target-name, you can narrow the range of monitoring target groups whose monitoring data are to be exported. Monitor-target-name is the name of an monitoring target group.
Operand Description For example, you can specify RCLU CL1-C.01:CL2-A.01, but you cannot specify RCLU CL2-A.01:CL1-C.01. Also, you can specify RCLU CL1-C.01:CL1-C.03, but you cannot specify RCLU CL1-C.03:CL1-C.01. If port-name.host-group-id is not specified, the monitoring data of all the volumes (LUs) will be exported.
Operand Description If JNL-group-id is not specified, the monitoring data of all the journal volumes will be exported. URLU[[port-name.host-group-id]: [port-name.host-group-id]][…] Use this operand when you want to export statistics about remote copy operations which are displayed in the Usage Monitor tab in the Cnt Ac-J and Cnt Ac-J Z window.
Operand Description internal|virtual] data at volumes controlled by a particular CU. When statistics are exported to a ZIP file, multiple ZIP files whose names are beginning with LDEV_ will be output. For details on the statistics exported by this operand, see Table 11 (page 93). When you specify variables LDKC-CU-id, you can narrow the range of LDKC:CUs that control the volumes whose monitoring data are to be exported. LDKC-CU-id is an ID of a LDKC:CU. The colon (:) indicates a range.
short-range Description Use this subcommand to specify a term of monitoring data to be exported into files. Use this subcommand when you want to narrow the export-target term within the stored data. The short-range subcommand is valid for monitoring data in short range. Short-range monitoring data appears in the following windows: • The Monitor Performance window when Short-range is selected as the storing period. • The Usage Monitor tab in the Cnt Ac-S and Cnt Ac-S Z windows.
Operand Description than the original time. If this change occurs to the time on the right of the colon, the time will be larger than the original time. The following are the examples: • If the time on the left is 10:15, the time on the right is 20:30, and the sampling interval is 10 minutes: The time on the left will be changed to 10:10 because the last two digits of the time is not a multiple of 10 minutes.
The long-range subcommand is valid for monitoring data in long range. The monitoring data in long range is the contents displayed in the Physical tab of the Performance Management window with selecting long-range as the storing period. The monitoring items whose data can be stored in long range are limited. The following table shows the monitoring items to which the long-range subcommand can be applied, and also shows the operands to export those monitoring items.
Operand Description Ensure that mm is 00, 15, 30, or 45. If you do not specify mm in this way, the value on the left of the colon (:) will be rounded down to one of the four values. Also, the value on the right of the colon will be rounded up to one of the four values. For example, if you specify 200601010013:200601010048, the specified value is regarded as 200601010000:200601010100. Examples The examples below assume that: • The starting time for collecting monitoring data is Jan. 1, 2006, 00:00.
Operand Description If the specified directory does not exist, this subcommand creates a directory that has the specified name. If this operand is omitted, the current directory is assumed.
Syntax apply set Description The set subcommand starts or ends monitoring the storage system (i.e., starts or ends collecting performance statistics). The set subcommand also specifies the gathering interval (interval of collecting statistics) in short range monitoring. If you want to use the set subcommand, you must use the login subcommand (see “login” (page 66) to log on to SVP. Ensure that the set subcommand executes immediately before the Export Tool finishes.
svpip 158.214.135.57 login expusr passwd show group Portshort -range 200604010850:200604010910 applyset switch=off The following command file starts monitoring remote copy operations. The sampling time interval is 10 minutes: svpip 158.214.135.57 login expusr passwd set switch=10 help Description The help subcommand displays the online help for subcommands.
Operand Description The path must be enclosed in double quotation marks ("). property-parameters You can specify the following parameters. At minimum you must specify -Dmd.command. • -Dhttp.proxyHost=host-name-of-proxy-host, or -Dhttp.proxyHost=IP-address-of-proxy-host Specifies the host name or the IP address of a proxy host. You must specify this parameter if the computer that runs the Export Tool communicates with SVP via a proxy host. • -Dhttp.
the CSV files. You can also configure the Export Tool to save monitoring data in CSV files instead of ZIP files. Monitoring data exported by the Export Tool The following table shows the correspondence between the Performance Management windows and the monitoring data that can be exported by the Export Tool. For details on the data contained in the corresponding ZIP files and CSV files, see the tables indicated in the links in the Monitoring data column.
Resource usage and write-pending rate statistics The following table shows the file names and types of information in the Monitor Performance window that can be saved to files using the Export Tool. These files contain statistics about resource usage and write pending rates. Table 8 Files with statistics about resource usage and write pending rates ZIP file CSV file Data saved in the file PhyPG_dat.zip PHY_Long_PG.csv Usage rates for parity groups in long range PHY_Short_PG.
Table 8 Files with statistics about resource usage and write pending rates (continued) ZIP file CSV file Data saved in the file PhyESW_dat.zip PHY_Long_CHA_ESW.csv Usage rates for access paths between channel adapters and cache memories in long range PHY_Long_DKA_ESW.csv Usage rates for access paths between disk adapters and cache memories in long range PHY_Short_CHA_ESW.csv Usage rates for access paths between channel adapters and cache memories in short range PHY_Short_DKA_ESW.
Table 9 Files with statistics about parity groups, external volume groups or V-VOL groups (continued) ZIP file CSV file Data saved in the file PG_Write_TransRate.csv The size of the write data transferred per second (KB/sec) PG_Read_IOPS.csv The number of read operations per second PG_Seq_Read_IOPS.csv The number of sequential read operations per second PG_Rnd_Read_IOPS.csv The number of random read operations per second PG_CFW_Read_IOPS.
Table 10 Files with statistics about volumes in parity / external volume groups, or in V-VOL groups ZIP file CSV file Data saved in the file LDEV_IOPS.zip LDEV_IOPS_x-y.csv The number of read and write operations per second LDEV_TransRate.zip LDEV_TransRate_x-y.csv The size of data transferred per second (KB/sec) LDEV_Read_TransRate.ZIP LDEV_Read_TransRate_x-y.csv The size of read data transferred per second (KB/sec) LDEV_Write_TransRate.ZIP LDEV_Write_TransRate_x-y.
Volumes in parity groups, external volume groups, or V-VOL groups (at volumes controlled by a particular CU) The following table shows the file names and types of information in the Monitor Performance window that can be exported to files using the Export Tool. These files contain statistics about volumes in parity groups, external volume groups, or V-VOL groups (at volumes controlled by a particular CU).
Table 11 Files with statistics about volumes in parity groups, external volume groups, or V-VOL groups (at volumes controlled by a particular CU) (continued) ZIP file CSV file Data saved in the file LDEV_BackTrans.zip LDEV_BackTrans_xx.csv The number of data transfer operations between cache memories and hard disk drives (i.e., volumes) LDEV_C2D_Trans.zip LDEV_C2D_Trans_xx.csv The number of data transfer operations from cache memories and hard disk drives (i.e., volumes) LDEV_D2CS_Trans.
Table 13 Files with statistics about host bus adapters connected to ports ZIP file CSV file Data saved in the file PortWWN_dat.zip PortWWN_xx_IOPS.csv The I/O rate (that is, the number of read and write operations per second) for HBAs that are connected to a port PortWWN_xx_KBPS.csv The size of data transferred per second (KB/sec) between a port and the HBAs connected to that port PortWWN_xx_Response.
All host bus adapters connected to ports The following table shows the file names and types of information in the Monitor Performance window that can be exported to files using the Export Tool. These files contain statistics about all host bus adapters connected to ports. Table 15 Files with statistics about all host bus adapters connected to ports ZIP file CSV file Data saved in the file PPCGWWN_dat.zip PPCGWWN_NotGrouped_IOPS.
Remote copy operations by Cnt Ac-S and Cnt Ac-S Z (for each volume (LU)) The following table shows the file names and types of information in the Usage Monitor tab in the Cnt Ac-S and Cnt Ac-S Z window that can be exported to files using the Export Tool. These files contain statistics about remote copy operations (for each volume (LU)) by Continuous Access Synchronous and Continuous Access Synchronous Z.
Table 19 Files with statistics about remote copy operations by Cnt Ac-S and Cnt Ac-S Z (at volumes controlled by a particular CU) 98 ZIP file CSV file Data saved in the file RCLDEV_All_RIO.zip RCLDEV_All_RIO_xx.csv The total number of remote I/Os (read and write operations) RCLDEV_All_Read.zip RCLDEV_All_Read_xx.csv The total number of remote read I/Os RCLDEV_All_Write.zip RCLDEV_All_Write_xx.csv The total number of remote write I/Os RCLDEV_RIO_Error.zip RCLDEV_RIO_Error_xx.
Table 19 Files with statistics about remote copy operations by Cnt Ac-S and Cnt Ac-S Z (at volumes controlled by a particular CU) (continued) ZIP file CSV file Data saved in the file by the initial copy or Resync copy operation Note: • The letters "xx" in CSV filenames indicate a CU image number. For example, if the filename is RCLDEV_All_RIO_10.csv, the file contains the total number of remote I/Os of the volumes controlled by the CU whose image number is 10.
Table 21 Files with statistics about remote copy operations by Cnt Ac-J and Cnt Ac-J Z (at journals) (continued) ZIP file CSV file Data saved in the file URJNL_Initial_Copy_Hit.csv The initial copy hit rate (percent) URJNL_Initial_Copy_Transfer.csv The average transfer rate (KB/sec) for initial copy operations URJNL_M-JNL_Asynchronous_RIO.csv The number of asynchronous remote I/Os per second at the primary storage system URJNL_M-JNL_Asynchronous_Journal.
Remote copy by Cnt Ac-J and Cnt Ac-J Z (at volumes controlled by a particular CU) The following table shows the file names and types of information in the Usage Monitor tab in the Cnt Ac-J and Cnt Ac-J Z window that can be exported to files using the Export Tool. These files contain statistics about remote copy operations (at volumes controlled by a particular CU) by Continuous Access Journal and Continuous Access Journal Z.
Invalid values of monitoring data Probable causes the monitoring data for the period when Performance Monitor stops monitoring is "-1." • If you added the CU during monitoring, specified longrange as the gathering interval, and collected monitoring data, the value "-1" is displayed as the monitoring data before the CU was added. The monitoring data in the CSV The value "-3" indicates that Performance Monitor failed to obtain monitoring data file includes "-3.
Possible problems Probable causes and recommended action computer running the Export Tool could be slow. Confirm whether you are using a computer that is not supported, or whether the computer is slow. Run the Export Tool again. If the error persists, contact HP Technical Support. If the error message ID is (0002 5510), probable error causes and solutions are: • An internal processing is being performed in the disk array. Alternatively, another user is changing configurations.
Export Tool messages Probable causes and recommended action Invalid length: token The length is invalid. Specify a value that has a correct length. Invalid range: range The specified range is invalid. Specify the correct range. Invalid value: "value" The specified value is invalid. Specify a correct value. Login failed An attempt to log into SVP failed. Probable causes are: • An incorrect operand is used for the svpip subcommand. • An incorrect operand is used for the login subcommand.
Export Tool messages Probable causes and recommended action Unable to use the command: command The specified subcommand is unavailable. Unable to use the group name: operand The specified operand of the group subcommand is unavailable. Unknown host: host The Export Tool cannot resolve the host name. Specify the correct host name. Unsupported command: command The Export Tool does not support the specified command. Specify a correct command.
B Performance Monitor GUI reference This chapter provides reference information about the Performance Monitor GUI. Performance Monitor main window • “Summary” • “Monitored CUs tab” • “Monitored WWNs tab” This is the main window for monitoring performance on your storage system. From this window you can set up monitoring parameters, start and stop monitoring, and view performance graphs. This window is available when Performance Monitor is selected in the Remote Web Console main window.
Summary The summary information of monitoring is displayed. Item Description Monitoring Switch Monitoring statuses of following: • Enabled: Performance Monitor is monitoring the storage system. • Disabled: The storage system is not being monitored. Sample Interval Current sampling interval, from 1 to 15 minutes, for which statistics are collected during short-range monitoring. This value is available when Enabled is selected in the Monitoring Switch field. If Disabled is selected, a hyphen appears.
Item Description Add New Monitored WWN Click to open the Add New Monitored WWN window. Edit WWN Click to open the Edit WWN window. Delete Unused WWNs Click to open Delete Unused WWNs window. Click More Action to display this button. Add to Ports Click to open the Add to Ports window. Click More Action to display this button. Export Click to export the monitored data to the CSV file. Click More Action to display this button.
Monitoring Switch Setting table Confirm the monitoring switch information to be changed. Item Description Monitoring Switch: Enable: Performance Monitor is monitoring the storage system Disable: Performance Monitor is not monitoring the storage system. Sample Interval: Time interval of collecting statistics. Monitor Performance window Use this window to specify the monitoring period and monitoring objects that will be displayed in graphs.
Data Range Specify a range of statistics. Short-Range is default when there is monitor data collected with Short-Range. However, Long-Range is default when there is no monitor data collected with Short-Range. • Short-Range: Graphs are displayed according to the value specified in the Sample Interval field in the Edit Monitoring Switch window. • Long-Range: Graphs are displayed 0, 15, 30, or 45 minutes every hour.
Help Opens the help topic for this window. Object and Monitor Data combinations The following table shows the possible Object and Monitor Data combinations that can be selected in the Performance Objects area of the Monitor Performance window. • If Controller is selected on the left side of the Object field, the item on the right side of Monitor Data field is blank.
Item on right side of Object field Item on left side of Monitor Data field Unit of monitoring data Port Throughput IOPS Data Trans. MB/s Response Time ms • If Logical Device is selected on the left side of the Object field, the item on the right side of the Object field is blank.
Item on left side of Monitor Data field Item on right side of Monitor Data field Unit of monitoring data Drive Usage Rate* None % Drive Access Rate* Read (Sequential) % Read (Random) Write (Sequential) Write (Random) Business Copy* None % * Only information about internal volumes is displayed. Information about external volumes and FICON DM volumes is not displayed. • If Parity Group is selected on the left side of the Object field, the item on the right side of the Object field is blank.
Item on left side of Monitor Data field Item on right side of Monitor Data field Unit of monitoring data Write Back Trans. Total count/sec Cache To Drive Drive To Cache (Sequential) Drive To Cache (Random) Drive Usage Rate* None % * Only information about internal volumes is displayed. Information about external volumes and FICON DM volumes is not displayed. • If LUN is selected on the left side of the Object field, the item on the right side of the Object field is blank.
Item on left side of Monitor Data field Item on right side of Monitor Data field Unit of monitoring data Write Back Trans. Total count/sec Cache To Drive Drive To Cache (Sequential) Drive To Cache (Random) • If External Storage is selected on the left side of the Object field, following items can be selected. Item on right side of Object field Item on left side of Monitor Data field Item on right side of Monitor Data field Unit of monitoring data Logical Device Data Trans.
Monitoring object Item Description HBA WWN WWN of the host bus adapter. A WWN is a 16-digit hexadecimal number used as the unique identifier for a host bus adapter. WWN Name Nickname of the host bus adapter. A WWN name is up to 64 alphanumeric characters and some signs. LDEV ID ID of the volume, in the following format: LDKC:CU:LDEV. Only the LDEVs assigned to the user are displayed. LDEV Name Name of the LDEV. LDEV Name is the combination of fixed characters and numbers.
Unmonitored CUs table A table of the CUs that are going to be unmonitored. Item Description CU Unmonitored CU number. Number of LDEVs Number of LDEVs included in the unmonitored CUs. Current Monitor Mode - Enabled: The CU is a monitoring target object. - Disabled: The CU is not a monitoring target object. Select by Parity Group Click to open the Select by Parity Group window, where you can select CUs from parity groups. Add Click to add CUs to Monitored CUs table.
Selected CUs to Enable Monitor table Confirm the information about the CUs to be monitored. Item Description CU Number of CU to be monitored. Number of LDEV Number of LDEVs in the CU to be monitored. View CU Matrix Click to open the View CU Matrix dialog window where you can view the monitoring status of all the CUs in one LDKC. Selected CUs to Disable Monitor table Information about the CUs not to be monitored. Item Description CU Number of CU not to be monitored.
Monitored CUs table Item Description Monitored CUs The table consists of cells representing CUs. One cell corresponds to one CU. Each row consists of 16 cells (CUs). A set of 16 rows represents CUs for one logical DKC (LDKC). The table header row shows the last digit of each CU number in the form of +n (where n is an integer from 0 to 9, or a letter from A to F). Number of Monitored CUs Total count of monitored CUs.
Select by Parity Groups window Use this window to monitor CUs in the parity group. Use this window when you monitor CUs included in a specific parity group. When you select a parity group and click Detail in this window, you can view the CUs in the parity group. When you select the parity group and click OK , the CUs are selected in the Unmonitored CUs table. Available Parity Groups table Item Description Parity Group ID ID of the parity group. Number of CUs Number of CUs included in the parity group.
Parity Group Properties table Item Description Parity Group ID ID of the parity group. CUs table Item Description CU ID of the CU in this parity group. Number of LDEVs Number of LDEVs included in the individual CUs. Close Closes this window. Help Opens the help topic for this window. Edit WWN wizard Edit WWN window Use this window to edit the HBA WWN and WWN name of the WWN to be monitored.
HBA WWN Edit the worldwide name of the host bus adapter. WWNs are 16-digit hexadecimal numbers used to identify host bus adapters. WWN Name Edit a WWN name. Use up to 64 alphanumeric characters and some symbols for a WWN name. Confirm window Use this window to confirm the edited HBA WWN and WWN Name and to assign a name to the editing task. Monitored WWNs table Confirm the information about the WWNs to be monitored. Item Description HBA WWN HBA WWNs to be applied. WWN Name WWN Names to be applied.
Unmonitored WWNs table A table of WWNs that are going to be unmonitored. Item Description Port ID Name of the port. HBA WWN Worldwide name of the host bus adaptor WWN Name A WWN name is up to 64 alphanumeric characters and some signs. Current Monitor Mode Monitoring modes indicate whether WWNs are monitoring target objects or not. Enabled: The WWN is the monitoring target object. Disabled: The WWN is not the monitoring target object. Current Status Status of the port connected with WWN.
Item Description Disabled: The WWN is not the monitoring target object. Current Status Status of the port connected with WWN. Normal: All WWNs connected with the port are monitoring target objects. Non-Integrity: A part of WWNs are not monitoring target object among WWNs connected with the port. Confirm window Use this window to confirm the edited monitoring information. Selected WWNs to Enable Monitor table Confirm the information about the WWNs to be monitored.
Selected WWNs to Disable Monitor table Confirm the information about the WWNs not to be monitored. Item Description Port ID Port name not to be monitored. HBA WWN Worldwide name of the host bus adapter not to be monitored. WWN Name Nickname of WWN not to be monitored. The name consists of up to 64 alphanumeric characters and some signs. Status Status of a WWN not to be monitored. Normal: The WWN connected with a port is the monitoring target object.
HBA WWN Specify a worldwide name of the host bus adapter. WWNs are 16-digit hexadecimal numbers used to identify host bus adapters. WWN Name Specify a worldwide name using up to 64 characters for a WWN name. Available Ports table Item Description Port ID Name of the port available in the storage system. Number of Monitored WWNs Number of monitored WWNs in the port. Number of Unmonitored WWNs: Number of unmonitored WWNs in the port.
Selected WWNs table Confirm the list of combinations of ports and WWNs added as monitoring target objects. Item Description Port ID Name of the port selected for monitoring. HBA WWN WWN selected for monitoring. WWN Name WWN name is up to 64 alphanumeric characters and some signs. Add to Ports wizard Add to Ports window Use this window to add a WWN to the port.
HBA WWN Specify a worldwide name of the host bus adapter. WWNs are 16-digit hexadecimal numbers used to identify host bus adapters. WWN Name Specify a worldwide name using up to 64 characters for a WWN name. Available Ports table A list of available ports in the storage system. Item Description Port ID Name of the port available in the storage system. Number of Monitored WWNs Number of monitored WWNs in the port. Number of Unmonitored WWNs Number of unmonitored WWNs in the port.
Selected WWNs table Confirm the information of the WWNs to become the monitoring target objects. Item Description Port ID Name of the port selected for monitoring. HBA WWN WWN selected for monitoring. WWN Name WWN name is up to 64 alphanumeric characters and some signs. Monitor window Use this window to view line graphs of monitored objects.
Item Description Graph panel Shows line graphs. The line graph is displayed at the left of the graph panel, and explanatory notes are displayed at the right of the graph panel. Following operations can be performed. • If you locate the mouse cursor to each point of the graph, a detailed value is displayed with the tool chip. • When you click the explanatory note on the right of the graph panel, you can display or hide points on the graph panel.
Graph display area Shows graph panels. Item Description Monitoring Term Shows the monitor period in the bottom left corner of this window. The first monitored time and the latest time are shown. If Use Real Time is selected, the interval is also shown. The following icon and the message are displayed while changing the configuration: Graph(s) cannot be updated due to the configuration changing. Wait for a while.
Cancel Cancels this operation and closes this window. Help Opens the help topic for this window. Edit Performance Objects window Use this window to select the monitoring object for displaying in a performance graph. Object Object types to display graphs. The list on the left specifies a large classification of monitoring objects. The list on the right specifies a small classification of monitoring objects. Monitor Data Performance data specified in the Object field.
Item Description Object ID ID of the monitoring object. Remove Remove the object in this table. OK Displays the graph. Cancel Cancels this operation and closes this window. Help Opens the help topic for this window. Object and Monitor Data combinations The following table shows the possible Object and Monitor Data combinations that can be selected in the Performance Objects area of the Monitor Performance window.
• If Port is selected on the left side of the Object field, the item on left side of the Object and Monitor Data fields are blank. Item on right side of Object field Item on left side of Monitor Data field Unit of monitoring data None Throughput IOPS None Data Trans. MB/s None Response Time ms • If WWN is selected on the left side of the Object field, the item on the right side of the Monitor Data field is blank.
Item on left side of Monitor Data field Item on right side of Monitor Data field Unit of monitoring data Write (Random) Write (CFW) Data Trans. Total MB/s Read Write Response Time Total ms Read Write Back Trans. Total count/sec Cache To Drive Drive To Cache (Sequential) Drive To Cache (Random) Drive Usage Rate* None % Drive Access Rate* Read (Sequential) % Read (Random) Write (Sequential) Write (Random) Business Copy* None % * Only information about internal volumes is displayed.
Item on left side of Monitor Data field Item on right side of Monitor Data field Unit of monitoring data Read (Sequential) Read (Random) Read (CFW) Write (Total) Write (Sequential) Write (Random) Write (CFW) Data Trans. Total MB/s Read Write Response Time Total ms Read Write Back Trans. Total count/sec Cache To Drive Drive To Cache (Sequential) Drive To Cache (Random) Drive Usage Rate* None % * Only information about internal volumes is displayed.
Item on left side of Monitor Data field Item on right side of Monitor Data field Unit of monitoring data Read (Sequential) Read (Random) Read (CFW) Write (Total) Write (Sequential) Write (Random) Write (CFW) Data Trans. Total MB/s Read Write Response Time Total ms Read Write Back Trans. Total count/sec Cache To Drive Drive To Cache (Sequential) Drive To Cache (Random) • If External Storage is selected on the left side of the Object field, following items can be selected.
Available Objects table The items appearing in the Available Objects table depend on the objects selected in the Performance Objects fields. Monitoring object Item Description Port Port ID Name of the port. Only the ports assigned to the user are displayed. WWN/WWN HBA WWN Worldwide name of the host bus adapter. A WWN is a 16-digit hexadecimal number used as the unique identifier for a host bus adapter. Only the WWNs that correspond to the ports assigned to the user are displayed.
Monitoring object Access Paths Item Description Cache Name of the cache. Access Paths Name of the access path. Add Graph window Use this window to add the monitoring object to display a graph. Object Object types to display graphs. The list on the left specifies a large classification of monitoring objects. The list on the right specifies a small classification of monitoring objects. Monitor Data Performance data specified in the Object field.
Selected Objects table Objects to display the graph. Item Description Object Object to display the graph. Monitor Data Type of monitoring data. Object ID ID of the monitoring object. Remove Remove the object in this table. OK Shows the graph. Cancel Cancels this operation and closes this window. Help Opens the help topic for this window.
• If Port is selected on the left side of the Object field, the item on left side of the Object and Monitor Data fields are blank. Item on right side of Object field Item on left side of Monitor Data field Unit of monitoring data None Throughput IOPS None Data Trans. MB/s None Response Time ms • If WWN is selected on the left side of the Object field, the item on the right side of the Monitor Data field is blank.
Item on left side of Monitor Data field Item on right side of Monitor Data field Unit of monitoring data Write (Random) Write (CFW) Data Trans. Total MB/s Read Write Response Time Total ms Read Write Back Trans. Total count/sec Cache To Drive Drive To Cache (Sequential) Drive To Cache (Random) Drive Usage Rate* None % Drive Access Rate* Read (Sequential) % Read (Random) Write (Sequential) Write (Random) Business Copy* None % * Only information about internal volumes is displayed.
Item on left side of Monitor Data field Item on right side of Monitor Data field Unit of monitoring data Read (Sequential) Read (Random) Read (CFW) Write (Total) Write (Sequential) Write (Random) Write (CFW) Data Trans. Total MB/s Read Write Response Time Total ms Read Write Back Trans. Total count/sec Cache To Drive Drive To Cache (Sequential) Drive To Cache (Random) Drive Usage Rate* None % * Only information about internal volumes is displayed.
Item on left side of Monitor Data field Item on right side of Monitor Data field Unit of monitoring data Read (Sequential) Read (Random) Read (CFW) Write (Total) Write (Sequential) Write (Random) Write (CFW) Data Trans. Total MB/s Read Write Response Time Total ms Read Write Back Trans. Total count/sec Cache To Drive Drive To Cache (Sequential) Drive To Cache (Random) • If External Storage is selected on the left side of the Object field, following items can be selected.
Available Objects table The items appearing in the Available Objects table depend on the objects selected in the Performance Objects fields. Monitoring object Item Description Port Port ID Name of the port. Only the ports assigned to the user are displayed. WWN/WWN HBA WWN World Wide Name of the host bus adapter. A WWN is a 16-digit hexadecimal number used as the unique identifier for a host bus adapter. Only the WWNs that correspond to the ports assigned to the user are displayed.
Monitoring object Access Paths 146 Performance Monitor GUI reference Item Description Cache Name of the cache. Access Paths Name of the access path.
C Cache Residency GUI reference This topic provides reference information about the Cache Residency GUI. Cache Residency Window This window provides the Cache Residency information for the connected P9500 storage system and provides access to all Cache Residency operations.
Item Description Prestaging Enables and disables the prestaging function for Cache Residency. If you select the Prestaging check box check box and click Apply, a Yes/No confirmation is displayed. To perform a Cache Residency operation followed by a prestaging operation, click Yes. To perform only the Cache Residency operation, click No . If you clear the Prestaging check box and click Apply, only a Cache Residency operation is performed.
Item Description Cache information The cache information area provides information on the P9500 cache usage. The cache information area also indicates when prestaging operations and cache residency operations are in progress. Operations Use add data to and release data from Cache Residency cache. Apply Starts the requested operation(s) with or without prestaging. Cancel Cancels the requested operation(s) and closes the dialog box.
Item Description Pie chart Blue indicates cache that has been used. Yellow indicates the increase in the specified size of the cache. Pink indicates the remaining amount of available cache. Operation in progress Indicates the operation that is in progress. • Prestaging operation in progress: The progress, in percentage, of the prestaging operation. The percentage shown in this progress bar does not affect the pie chart nor the values in the Operation box.
Item Description This feature does not allow you to select and cancel an individual Cache Residency data area specified for an LDEV. You must perform a Release operation to cancel an individual data area. Set Adds the requested set operation (place data in Cache Residency cache) to the LDEV information table. This button is available when you select a data area that is not in cache in the LDEV table.
Item Description LDKC Selects the LDKC that contains the desired CU and LDEV(s). CU Selects the CU image that contains the desired LDEV(s). Only CUs owned by the selected CLPR are displayed in the Multi Set dialog box. LDEV LDEVs in the selected CU image that are available for the Multi Set function. Note that only volumes owned by the CLPR selected from the CLPR list in the Cache Residency window are shown in the LDEV table. Set Saves the requested Set operations, and closes the dialog box.
Multi Release dialog box Use this dialog box to release Cache Residency data from cache for more than one LDEV. To open this dialog box, In the Cache Residency window, select an LDEV that has all data stored in Cache Residency cache, check the Multi Set/Release box, and then click Release. The Multi Release function applies only to LDEVs that have all data stored in Cache Residency cache. To release individual cache extents, select the cache extents in the LDEV information table and click Release.
Glossary allocation The ratio of allocated storage capacity versus total capacity as a percentage. Allocated storage refers to those logical devices (LDEVs) that have paths assigned to them. Allocated storage capacity is the sum of the storage of these LDEVs. Total capacity is the sum of the capacity of all LDEVs on the disk array. CHA Channel adapter. A device that provides the interface between the array and the external host system.
RAID Manager The CLI configuration and replication tool for the P9000 or XP disk array that system administrators can use to enter RAID Manager commands from open-system hosts to perform Continuous Access, Business Copy, Database Validator, and Data Retention operations, as well as provisioning commands on logical devices. Remote Web Console A browser-based program installed on the SVP that allows you to configure and manage the disk array. RIO Remote I/O. SVP Service processor.
Index viewing monitoring status, 16 A access paths and I/O usage rates, 28 B back-end performance and I/O usage rates, 33 batch file preparing for use with Export Tool, 59 running for Export Tool, 60 using termination codes in Export Tool, 62 bind mode, 9 and cache size requirements, 38 Business Copy I/O usage rates, 35 C cache area, 7 extents, 41 hit rates and I/O usage rates, 32 managing, 43 memory and I/O usage rates, 27 placing LDEVs into cache, 47 placing specific data into cache, 45 releasing LDEVs
access paths, 28 back-end performance, 33 Business Copy, 35 cache hit rates, 32 cache memory, 27 data recovery and reconstruction processor, 26 data transfer size, 30 hard disk drive, 34 hard disk drive access, 34 processor blades, 26 throughput, 29 write pending, 27 interoperability Performance Monitor with other software, 12 R RAID levels and cache size requirements, 38 related documentation, 51 releasing LDEVs from cache, 48 releasing specific data from cache, 47 replace microcode, 13 resident cache man