
HP P9000 Continuous Access Synchronous User Guide (AV400-96400, October 2011)
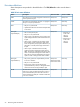
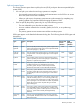
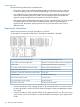
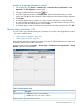

Table 25 Usage Monitor fields (continued)
DescriptionItem
The most recent data sample time on the graph.Update
Remote I/O statistics and status of remote copy monitor.Usage Monitor
Graph
Select data to be graphed
The usage monitor graph plots the I/O data that you specify. On the graph:
• The X-axis indicates time.
• The Y-axis indicates the number of I/Os during the sampling period.
• The legend on the right side shows the data being displayed.
The value on the Y-axis varies according to the maximum value of the statistical data appearing
in the graph. If the Y-axis value exceeds 10,000,000, the value is shown in exponential notation
(for example, 1E7 = 1×107 = 10,000,000; 2E8 = 2×108 = 200,000,000).
Procedure 12 To specify I/O data to be graphed
1. Make sure that usage monitoring is running (Monitoring Switch = Enable). The usage monitor
graph can be viewed only when monitoring is on.
2. On the menu bar, click Actions > Remote Copy > Continuous Access Synchronous > Usage
Monitor. The Usage Monitor window opens.
3. Change to Modify mode by clicking the icon.
4. Right-click the graph and select Display Item from the menu. The Display Item dialog box
displays.
5. In the Select Volume box, select one of the following:
• ALL Volumes, to view I/O statistics for all LDEVs in the system. When selected, the LDKC
number, CU number, and LDEV number appear above the graph.
◦ A device ID ending in # (e.g., 00:00:3C #) indicates the LDEV is an external volume.
For more information, see the HP P9000 External Storage for Open and Mainframe
Systems User Guide.
◦ A device ID ending in X (e.g., 00:00:3C X) indicates the LDEV is a Thin Provisioning
virtual volume. For more information, see the HP P9000 Provisioning for Open
Systems User Guide.
• Volume, to view I/O statistics for a specific LU. Select the LU Port (CL1-A to CLG-M) and
enter the GID (00-FE) and LUN (000-7FF).
6. In the Monitor Data boxes, select the I/O statistics data that you want to appear on the graph.
You must select at least one box. The following describes the selections you can make.
Table 26 Remote copy I/O statistics data
DescriptionData type
RIO Count
Total number of remote I/OsAll RIO Count
Total number of write I/OsAll Write Count
Number of errors that occur during remote I/ORIO Error Count
Initial Copy
Number of initial copy remote I/OsInitial copy RIO count
60 Monitoring and maintenance