
XPWatch and XPSketch Reference guide for HP XP P9000 Performance Advisor

for viewing, more is the memory required for plotting the numerous data points from the selected
metrics.
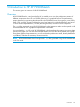
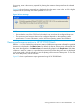
Figure 24 shows the error message that is displayed when the metric count in the .csv file is higher
compared to the Java heap size value specified in run.bat.
Figure 24 Error message
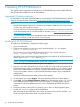
NOTE:
• Ensure that the size of the CSV file to be loaded is not more than the configured heap size.
• The maximum Java heap size that can be configured depends on the operating system
specification. For more information, see the Windows operating system documentation.
Viewing performance metrics in HP XP P9000Sketch
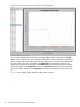
After the .csv file is loaded, the performance metrics of different components collected for specified
durations are displayed in the Metrics Pane. By default, the first set of data points collected for the
first metric that appears in the Metrics Pane is automatically plotted in the Graph Area. If the data
collection is more for a metric in a specified time interval and all the data points are not displayed
in the same graph, click the > button to view the plotting of the next set of data points. To view the
first set of data points, click the < button.
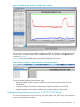
Figure 25 shows a performance report generated using HP XP P9000Sketch.
Viewing performance metrics in HP XP P9000Sketch 57