
P9000Watch and P9000Sketch Reference guide for HP StorageWorks P9000 Performance Advisor v5.4 (T1789-96332, April 2012)
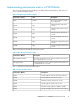


DescriptionPerformance Metrics
DKA to cache memory Xbar utilization [%]DKA to cache memory utilization [%]
Cache usage for CLPR0 [MB]Cache usage [MB]
Write cache usage for CLPR0 [MB]Write cache usage [MB]
Side File usage for CLPR0 [MB]Side File usage [MB]
Cache random read hits for CLPR0Cache random read hits
Cache utilization for CLPR0Cache utilization [%]
Write cache utilization [%] for CLPR0, max=70%Write cache utilization [%]
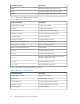
Table 32 describes the CLPR performance metrics.
Table 32 CLPR performance metrics
DescriptionPerformance Metrics
CLPR Size [MB] for CLPRCLPR Size [MB] for CLPR
Cache memory usage [MB] for CLPRCache memory usage [MB] for CLPR
Cache write pending [MB] for CLPRCache write pending [MB] for CLPR
Cache sidefile usage [MB] for CLPRCache sidefile usage [MB] for CLPR
Cache Random read hits for CLPRCache Random read hits for CLPR
Cache memory usage [%] for CLPRCache memory usage [%] for CLPR
Cache write pending [%]Cache write pending [%]
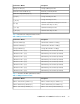
Table 33 describes the CLPR performance metrics.
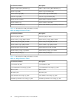
Table 33 JNL performance metrics
DescriptionPerformance Metrics
Journal State for JID#Journal State for JID#
Journal Utilization Percentage [%] JID#Journal Utilization Percentage [%] JID#
Q-Count JID#Q-Count JID#
Q-Marker JID#Q-Marker JID#
Ldev Utilization Percentage [%] JID#Ldev Utilization Percentage [%] JID#
Raid Group Utilization Percentage [%] JID#Raid Group Utilization Percentage [%] JID#
Viewing performance metrics in P9000Sketch74