
P9000Watch and P9000Sketch Reference guide for HP StorageWorks P9000 Performance Advisor v5.4 (T1789-96332, April 2012)


CPU performance metrics
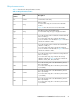
Table 23 describes the CPU performance metrics.
Table 23 CPU performance metrics
DescriptionUnit
Performance
metrics
Serial number of the arraynumberSer
CH slot number.
For P9000 disk arrays, the slot refers to the MP blade
location.
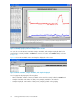
Figure 24 shows the slots are shown as MA and MP
stringSlot
CH PCB type (Fibre/SCSI/FICON/DKA).
For P9000 disk arrays, the type is displayed as MPPK.
stringType
For an XP disk array, Min% indicates the minimum CPU util-
ization on PCB [%].
For a P9000 disk array, Min% indicates the minimum
processor utilization on an MP blade. In Figure 24 the Min%
indicates the utilization of MP3.
%Min%
For an XP disk array, Max% indicates the maximum CPU
utilization on PCB [%].
For a P9000 disk array, Max% indicates the maximum
processor utilization on an MP blade. In Figure 24 the Max%
indicates the utilization of MP0.
%Max%
For an XP disk array, Avg% indicates the average CPU util-
ization on PCB [%].
For a P9000 disk array, Avg% indicates the average
utilization of all MPs. In Figure 24 the Avg% indicates the
utilization of MP0, MP1, MP2, and MP3.
%Avg%
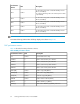
For an XP disk array, MP0 is the CHA PCB Busy Time for
CPU 0 (if installed).
For a P9000 disk array, MP0 is the MP busy time for CPU
0 (if installed).
numberMP0
For an XP disk array, MP1 is the CHA PCB Busy Time for
CPU 1 (if installed).
For a P9000 disk array, MP1 is the MP busy time for CPU
1 (if installed).
numberMP1
For an XP disk array, MP2 is the CHA PCB Busy Time for
CPU 2 (if installed).
For a P9000 disk array, MP1 is the MP busy time for CPU
2 (if installed).
numberMP2
P9000Watch and P9000Sketch Reference Guide 61