
P9000Watch and P9000Sketch Reference guide for HP StorageWorks P9000 Performance Advisor v5.4 (T1789-96332, April 2012)

IMPORTANT:
• To view correct cache metrics for P9500 disk arrays, ensure that v70-03-00-00/02 is the minimum
firmware version on the disk array. Similarly, to view cache metrics for XP24000 disk array, ensure
that v60-08-05-00/00 is the minimum firmware version on the disk array.
• The performance data is displayed for all the continuous access ports irrespective of whether you
view the Sync/Async metrics or the CA Journal metrics.
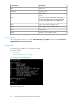
The output files in the Interactive mode and CLI mode are saved in the TLVIz and TABS format
respectively. The output files in the Interactive mode can be imported into P9000Sketch. However,
the output files in the CLI mode cannot be imported into P9000Sketch. You can write scripts or wrappers
for the data in the output files to view or plot the data in the desired format. The description of the
different tabs for different components in the output files are listed in the sections given below.
The TLViz is an interactive timeline visualization tool that provides a graphical representation of the
data collected for each metric. The .csv files that are generated in the Interactive mode can be
plotted using this tool. For more information regarding TLVIz, see http://h71000.www7.hp.com/
openvms/products/t4/index.html.
NOTE:
The .csv output files containing the Sync/Async performance metrics or the CA Journal metrics are
available only in the Interactive mode.
Adjust your screen resolution (maximum resolution recommended) and font size accordingly for better
readability.
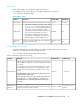
Sync/Async Metrics
The Sync/Async Metrics provides the configuration data of the selected P-VOLs and S-VOLs in the
disk array. In addition, it includes performance metrics of the following components:
• LDEVs configured as P-VOLs or S-VOLs.
• Continuous access ports configured for the synchronous or asynchronous communication.
The performance data is displayed for all the continuous access ports irrespective of whether you
view the Sync/Async metrics or the CA Journal metrics.
• RAID groups to which the P-VOLs or S-VOLs belong.
• CLPRs associated with the P-VOLs or S-VOLs, and configured to manage the cache transaction.
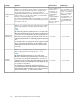
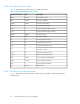
The Output screen and the four .csv output files that are generated, one file for each component,
contain performance metrics pertaining to the above mentioned LDEVs, ports, RAID groups, and CLPRs
of the selected XP or P9000 disk arrays.
Viewing performance metrics in P9000Watch48