
P9000Watch and P9000Sketch Reference guide for HP StorageWorks P9000 Performance Advisor v5.4 (T1789-96332, April 2012)

d. Select the required LDEVs.
e. Enter the c command. The following message appears:
Would you like to archive the performance data collected? (Y/N)
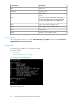
f. Enter Y to save the performance data in .CSV format. The Output screen appears.
NOTE:
The Output screen displays performance data of all selected host groups, ports, LDEVs,
RAID groups, and processors belonging to the selected XP or P9000 disk arrays.
g. Enter e or press Ctrl+C to quit P9000Watch.
• Skip and start collecting
Follow this procedure to skip all the selection process and collect performance data for all
the ports:
a. Enter 4 to select this option. The following message appears:
Would you like to archive the performance data collected? (Y/N)
b. Enter Y to save the performance data in .CSV format. The Output screen appears.
NOTE:
The Output screen displays performance data of all selected ports and processors
belonging to the selected XP or P9000 disk arrays.
c. Enter e or press Ctrl+C to quit P9000Watch.
NOTE:
If you enter N, the performance data is not saved in the .CSV format. However, you can view
the performance data on the output screen.
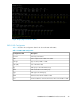
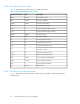
Understanding performance metrics
The .csv output files that are generated and data shown on the screen, one file for each component,
contain performance metrics for host groups, ports, LDEVs, RAID groups, CPU, DKC, and Array
utilization of the selected XP or P9000 disk arrays. You can also view the Sync/Async performance
metrics for P-VOLs and S-VOLs, and the CA Journal metrics for the consistency groups. Multiple .csv
output files are generated for each selection of P-VOLs and S-VOLs, or continuous access journals,
and includes additional performance metrics of the associated ports, CLPRs, and RAID groups.
P9000Watch and P9000Sketch Reference Guide 47