
P9000Watch and P9000Sketch Reference guide for HP StorageWorks P9000 Performance Advisor v5.4 (T1789-96332, April 2012)

4 Viewing performance metrics in
P9000Watch
This section describes how to collect the performance data of the XP and the P9000 disk arrays and
view the performance metrics using P9000Watch.
Collecting performance metrics
This section describes how to collect performance data of the XP and the P9000 disk arrays using
P9000Watch.
The Array menu appears after you invoke P9000Watch.
To collect the performance data of the XP and the P9000 disk arrays:
1. Start P9000Watch.
2. Enter the s command and set the Menu and Performance collection settings. For more information
on setting the Menu and Performance collection settings, see Settings menu.
3. Select the disk array from the list displayed.
4. Do one of the following:
• Enter 1 to view the Sync/Async metrics. Then, follow steps given for Viewing Sync/Async
metrics.
• Enter 2 to view the CA Journal metrics. Then, follow steps given for Viewing CA Journal
metrics.
• Enter 3 to view the Host Group Metrics. Then, follow steps given for Viewing Host Group
Metrics.
Sync/Async Metrics
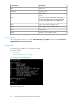
1. Select the P-VOLs and S-VOLs for which you want to view the Sync/Async metrics.
2. Enter the c command to view the output. The following message appears:
Would you like to archive the performance data collected? (Y/N)
3. Enter Y to save the performance data in .csv files. The data is also displayed on the screen.
4. Enter e or press Ctrl+C to quit P9000Watch.
CA Journal Metrics
1. Enter the CTG for which you want to view the CA Journal metrics. Only one CTG selection is al-
lowed.
2. Enter the c command to view the output. The following message appears:
Would you like to archive the performance data collected? (Y/N)
3. Enter Y to save the performance data in .csv files. The data is also displayed on the screen.
P9000Watch and P9000Sketch Reference Guide 45