
P9000Watch and P9000Sketch Reference guide for HP StorageWorks P9000 Performance Advisor v5.4 (T1789-96332, April 2012)


generated by P9000Watch in the Interactive mode can be loaded in P9000Sketch to obtain a visual
representation of the output data.
P9000Watch offers the following features:
• Focused troubleshooting
• Real-time performance data monitoring and collection for time intervals as low as 5 seconds
• In the CLI mode (Command Line Interface), the output screen has the timestamp when the data is
retrieved.
• Ability to split data in desired intervals and store them in different files
• Customizable menu size
• Nicknames can be provided to the host groups for easy identification
• Command-line tool with easy-to-use selection menu
• Configuration changes that are reflected with every fresh run
• Small footprint and easy to execute, does not require any special installation
For more information on installing the P9000 Performance Advisor, see the HP StorageWorks P9000
Performance Advisor Installation Guide.
P9000Watch environment
For information on the list of supported platforms, see the latest HP StorageWorks P9000 Performance
Advisor Software OS Support Matrix available at www.hp.com/go/PerformanceAdvisor-support-docs.
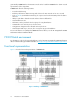
Functional representation
Figure 1 shows the functional representation of P9000Watch.
Figure 1 Working of P9000Watch
.
Introduction to P9000Watch10