P9000Watch and P9000Sketch Reference Guide This guide is designed to help you understand and use the P9000Watch and P9000Sketch tools. It describes the functional capabilities and operational details of P9000Watch and P9000Sketch, and provides some examples of how to use the tool.
Legal and notice information © Copyright 2012 Hewlett-Packard Development Company, L.P. Confidential computer software. Valid license from HP required for possession, use or copying. Consistent with FAR 12.211 and 12.212, Commercial Computer Software, Computer Software Documentation, and Technical Data for Commercial Items are licensed to the U.S. Government under vendor’s standard commercial license. The information contained herein is subject to change without notice.
Contents 1 Introduction to P9000Watch ................................................................ 9 Overview ................................................................................................................................... 9 P9000Watch environment ......................................................................................................... 10 Functional representation ..........................................................................................................
P-VOL S-VOL Port performance metrics ............................................................................ CA Journal Metrics ............................................................................................................. JNL (Journal Group) metrics ........................................................................................... Journal LDEV metrics ....................................................................................................
D Comparing LDEV response time metrics in P9000 Performance Advisor and P9000Watch ............................................................................... 83 Maximum values of LDEV response time in P9000 Performance Advisor and P9000Watch ................. Average values of LDEV response time in P9000 Performance Advisor and P9000Watch ................... Average read response time ................................................................................................
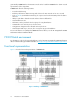
Figures 1 Working of P9000Watch ........................................................................................ 10 2 P9000 Performance Advisor logon screen .................................................................. 14 3 P9000 Performance Advisor home screen .................................................................. 14 4 P9000Watch commands ......................................................................................... 20 5 Array menu .......................................
Tables 1 Navigation options and their functions ....................................................................... 20 2 Selection options .................................................................................................... 21 3 Miscellaneous options ............................................................................................. 21 4 Syntax conventions ..................................................................................................
33 JNL performance metrics .......................................................................................... 74 34 Document conventions .............................................................................................
1 Introduction to P9000Watch This chapter describes the features of P9000Watch (previously called XPWatch) and the environment required to run it. Overview P9000Watch is a command-line interface utility provided with HP StorageWorks P9000 Performance Advisor. It is designed for focused troubleshooting and can capture data as frequently as every 5 seconds. NOTE: The 5 seconds data capture frequency applies to XP or P9000 disk array configured with any number of LDEVs.
generated by P9000Watch in the Interactive mode can be loaded in P9000Sketch to obtain a visual representation of the output data. P9000Watch offers the following features: • Focused troubleshooting • Real-time performance data monitoring and collection for time intervals as low as 5 seconds • In the CLI mode (Command Line Interface), the output screen has the timestamp when the data is retrieved.
The default mode in which the P9000Watch executes is the Interactive mode. In addition, the CLI mode is also available, where you can directly execute commands in the command prompt window to view the same data that is otherwise displayed when P9000Watch is executed using the Interactive method. For more information, see Executing commands in Interactive mode.
Introduction to P9000Watch
2 Installing P9000Watch This section describes installing and removing P9000Watch. It also describes the various components of P9000Watch. Prerequisites The following are the prerequisites to install P9000Watch: • The P9000 Performance Advisor host agent (v5.4 and above) must be installed on your host system. • The host must have a command device connected to the XP or P9000 disk arrays array to collect information from that disk array.
Figure 2 P9000 Performance Advisor logon screen . 3. Enter your User Name and Password and click Sign In. The P9000 Performance Advisor Home screen appears. Figure 3 shows the P9000 Performance Advisor Home screen. Figure 3 P9000 Performance Advisor home screen . 4. 5. 6. 7. On the Header menu, select Support. The screen displaying Table of Contents appears. From the Tools menu, select the operating system for which you want to download the P9000Watch zip file.
NOTE: • The P9000Watch bits are available in the Tools folder on P9000 Performance Advisor Installation disk 2. • To run the P9000Watch on Windows IA platform you must install RMLIB. To install RMLIB, execute RMLIB_Install.bat present in Windows IA XPWatch bits (xpwatch-winIA64binary.zip). • At any given point, you can close P9000Watch by pressing Ctrl+C.
There are three different commands that can be used. The entire command should be entered at the command prompt, without which P9000Watch will exit. For more information on the commands to execute P9000Watch in CLI mode, see Executing commands in CLI mode. Removing P9000Watch To remove P9000Watch, delete the folder containing the XPWatch.exe file. Components The software components of P9000Watch are: • XPWatch.exe — is an executable file used to launch the P9000Watch tool. • wagent.
NOTE: The Sync/Async Metrics are available only in the Interactive mode. • -PORTPERF-.csv • -PVOL_SVOL_CLPRPERF-.csv • -PVOL_SVOL_LDEVPERF-.csv • -PVOL_SVOL_RGPERF-.
• -DKCPERF-.csv • -HGPERF-.csv • -ARRAYPERF-.csv • CLI Mode Host Group metrics • -LDEVPERF-.csv • -PORTPERF-.csv • -RGPERF-.
3 Working with P9000Watch menus and commands This section describes how to use the different modes, commands, menus, and interfaces of P9000Watch. Commands This section describes the menus and the options you choose in the Interactive mode, as well as the commands that you execute in the CLI mode. To see the Help options in the Interactive mode and CLI mode, the following command can be executed in the command prompt: For Windows platform, xpwatch.exe –h For a non-Windows platform, .
Figure 4 P9000Watch commands . Table 1 lists the Navigation options available in the P9000Watch interface and their functions. Table 1 Navigation options and their functions Command Option Function b Back To view the previous menu. c Continue To view the next menu. n Next page To view the next set of items, such as host groups, ports, RAID groups, and LDEVs. p Previous page To view set of items, such as host groups, Ports, RAID groups, and LDEVs displayed on the previous page.
Table 2 lists the Selection options available in the P9000Watch interface and their functions. Table 2 Selection options Command Option Function a Select All To select all items in a given menu. r Select None To clear all the selected items in a given menu. Table 3 lists the Miscellaneous options available in the P9000Watch interface and their functions. Table 3 Miscellaneous options Command Option Function s Settings To change the settings of P9000Watch.
—s To specify the XP or P9000 disk array serial number. To specify the host group which has to be monitored. You can provide multiple entries for host groups. —hg NOTE: There should be no space in between the comma separating the host groups. For example, –hg Node7,Node8 —f This is an optional parameter. It is used to specify the .csv filename. If this option is not specified, the archive file (.csv file) will not be created. —a This is an optional parameter.
—f This is an optional parameter. It is used to specify the .csv filename. If this option is not specified, the archive file (.csv file) will not be created. —a This is an optional parameter. It is used to specify the frequency of archiving data in the .csv file. If this option is not specified then the previously specified value shall be used. For more information, see Table 11. —hrs This parameter is used to specify the number of hours for which P9000Watch must be active.
NOTE: For the –f option, do not specify the file extension in the command prompt window. It is mandatory to specify either the —hrs or —min option. You can also specify both the options. Menus P9000Watch enables you to monitor and customize performance data of P-VOLs, S-VOLs, continuous access journal groups, ports, RAID groups, LDEVs, and host groups through different menus.
Figure 5 Array menu . Table 5 lists the fields of the Array menu. Table 5 Array menu — fields Screen field Description Num Selection number Serial Serial number of the array Type Type indicates the array model. Supports P9000 disk array models such as, P9500 and XP disk array models such as XP 1024/48, XP10000, XP 12000, XP20000, and XP 24000. Sync/Async Metrics The Sync/Async Metrics screen lists all the configured P-VOLs. Figure 6 Sync/Async Metrics .
The Sync/Async Metrics provides configuration information for each P-VOL and S-VOL which includes data displayed in the following table: Screen field Description Num Selection Number. Sel S against a P-VOL or S-VOL record indicates that the particular record is selected. Pri Ser# Serial number of the XP or P9000 disk array. Ldev LDEV configured as P-VOL or S-VOL on the selected disk array (primary data center). Displays the LDEV number in cu:ldev format.
Viewing Sync/Async metrics To view the Sync/Async metrics for P-VOLs and S-VOLs: 1. 2. Start P9000Watch. The Array menu appears. Select the array whose performance you want to monitor, and then press the Enter key. The following list of host group options connected to the array is displayed: • 1 Sync/Async Metrics • 2 CA Journal Metrics • 3 Host Group Metrics 3. 4. Select 1, and then press the Enter key.
NOTE: The CA Journal Metrics are available only in the Interactive mode This metrics provide configuration information of each P-VOL or S-VOL, and includes the configuration data of journal groups configured to manage the corresponding I/O transactions. The following table describes the configuration data: Screen field Description CTG Consistency Group ID: A Group ID which guarantees consistency in the sequence of Asynchronous data transfers for a remote copy volume group.
Viewing CA Journal metrics To view CA Journal metrics for the P-VOLs, S-VOLs, and associated journal groups in an XP or a P9000 disk array: 1. 2. Start P9000Watch. The Array menu appears. Select the array whose performance you want to monitor and press the Enter key. The following list of host group options connected to the array is displayed: • 1 Sync/Async Metrics • 2 CA Journal Metrics • 3 Host Group Metrics 3. Select 2, and then press the Enter key.
Figure 8 Available Host Groups: Sorted Alphabetically . Table 6 lists the fields in the Host Groups. Table 6 Host Groups — fields Screen field Description Num Selection number Nickname User-friendly names given to the hosts. Host Group Name Displays the host group name. Ports The port used by the XP or P9000 disk array to communicate with the host. Viewing Host Groups To view the host groups connected to an array, perform the following steps: 1. 2. 30 Start P9000Watch. The Array menu appears.
Selecting Host Groups Select the host whose performance data you want to monitor. To select a host group, enter the number corresponding to it. For example, to select HWP10 and Kalam host groups (see figure Available Host Groups), perform the following steps: 1. Enter 111 and press the Enter key. The HWP10 host group is selected as shown in the following figure. NOTE: The selected host group is highlighted in green. Figure 9 shows one host group selected from the list of available host groups.
Figure 10 Available Host Groups: Two Host Groups selected . Clearing Host Groups To clear a selected host group, enter its corresponding number. For example, to clear the Kalam host group, enter 118 and press the Enter key. The Kalam host group is cleared. Figure 11 shows the screen that appears after clearing the Kalam host group.
Figure 11 Clearing a Host Group . NOTE: The cleared host groups are not highlighted in green. Nickname menu The Nickname menu enables you to provide a nickname to the host to identify the host easily. For example, you can identify a host that is known by FS-Pyramus as “PA_Watch_HA”. NOTE: • The Nickname menu can be accessed only from the host groups screen. • The nicknames must be provided when the P9000Watch is launched for the first time after installation.
Figure 12 Nickname menu . Assigning nicknames This section describes how to assign nicknames to a host group. For example, to assign a nickname to the FS-Pyramus host group, perform the following steps: 1. 2. 34 Navigate to the Available Host Groups screen. Type x. The following screen appears.
Figure 13 Nickname menu: Selecting a host group to assign nickname . 3. 4. Type 97 and press the Enter key. Enter the new nickname. For example, PA_Watch_HA. Figure 14 Nickname menu: Entering new nickname . 5. Press the Enter key. The following screen, showing nickname as PA_Watch_HA, appears.
Figure 15 Nickname menu: Displaying new nickname . Renaming nicknames To rename a nickname, perform the following steps: 1. 2. Select the host group whose nickname you want to rename and press the Enter key. Enter the new nickname and press the Enter key. Deleting nicknames To delete a nickname, select the host group whose nickname you want to remove and press the Enter key twice. For example, to remove the PA_Watch_HA nickname, perform the following steps: 1.
2. Press the Enter key. (Do not enter any new nickname) The Host Nickname is removed and the following screen appears. Port menu The Port menu lists all the ports that are connected to the selected host groups. This menu is used to select the port whose performance needs to be monitored or captured. Figure 16 shows the Port menu.
Figure 16 Port menu . Table 7 describes the fields that appear in the Port menu. Table 7 Port menu — screen fields Screen field Description Num Selection number Port Port number Slot Slot number Type Type of port (SCSI, Fibre, ESCON, iSCSI, ENAS, FCoE) Topo Connection type (N for point-point, NL for FC-AL) FLOGI Fabric login (Y/N) Mode Operating mode of the port (Target, MCU Initiator, RCU Target, e-LUN initiator) Secu Security switch (On/Off) Storage Logical Partition (SLPR) number.
Screen field Description Dg# Count of RAID groups mapped to the port LDEV# Count of LDEVs mapped to the port Lh# Count of unique LDEVs mapped to the port Viewing Port menu To view the ports connected to a host, perform the following steps: 1. 2. 3. 4. Start P9000Watch. The Array menu appears. Select the array whose performance you want to monitor and press the Enter key. The Available Host Groups screen displaying the list of host groups connected to the array appears.
3. 4. 5. The Available Host Groups screen displaying the list of host groups connected to the array appears. Select the required host and enter the c command. The Port menu showing all ports connected to the hosts appears. Select the required port and enter the c command. The Pick LDEVs/RAID Groups Selection Scheme screen appears. RAID Group menu The RAID Group menu lists the details of all RAID groups connected to the selected host(s). Figure 18 shows the RAID Group menu. Figure 18 RAID Group menu .
Screen field Description Pg The Pg column displays the entire list of concatenated RAID groups NOTE: • If the RAID groups are not configured, the RAID Group menu will display blank screen fields. • For non-concatenated RAID groups, the Rg and Pg columns display the same data.
Screen field Description RG RAID group Emulation Emulation type SLPR number NOTE: Slpr Slpr does not exist in the P9000 disk arrays. So, the Slpr field displays N/A for the P9000 disk array in the output screen of the LDEV menu.
Menu settings Menu settings enable you to modify the settings of the interface. For example, the Menu settings allow you to modify the appearance of the menus. Table 10 describes the Menu settings. Table 10 Menu settings Settings Functions Default Value Valid Range Menu Height Changes the number of items that appear in the menu. 20 lines 1-50 lines Disabled NA Deletes the cache files NA • If this mode is enabled, the program creates a file P9000Watch.
Settings Functions Enables you to specify the volume of data to be displayed in the output screen for ports, LDEVs, RAID groups, and host groups. Real-Time Monitor Size In case of Sync/Async metrics, you can set the number of PVOL/SVOLs, RAID Groups, CLPRs and Replication Ports. In case of CA Journals, you can also set the number of Journal Volumes and their corresponding RAID groups.
4 Viewing performance metrics in P9000Watch This section describes how to collect the performance data of the XP and the P9000 disk arrays and view the performance metrics using P9000Watch. Collecting performance metrics This section describes how to collect performance data of the XP and the P9000 disk arrays using P9000Watch. The Array menu appears after you invoke P9000Watch. To collect the performance data of the XP and the P9000 disk arrays: 1. 2. 3. 4. Start P9000Watch.
4. Enter e or press Ctrl+C to quit P9000Watch. Host Group Metrics 1. 2. 3. 4. Enter the host groups for which you want to view performance metrics. Enter the c command. A list of all the available ports appear. Select the required port. Enter the c command. The Pick LDEVs/RAID Groups Selection Scheme appears. • Filtering LDEVs by RAID Groups Follow this procedure to filter LDEVs by RAID groups: a. Enter 1 to select this option. The RAID groups within the host groups are displayed. b.
d. e. Select the required LDEVs. Enter the c command. The following message appears: Would you like to archive the performance data collected? (Y/N) f. Enter Y to save the performance data in .CSV format. The Output screen appears. NOTE: The Output screen displays performance data of all selected host groups, ports, LDEVs, RAID groups, and processors belonging to the selected XP or P9000 disk arrays. g. Enter e or press Ctrl+C to quit P9000Watch.
IMPORTANT: • To view correct cache metrics for P9500 disk arrays, ensure that v70-03-00-00/02 is the minimum firmware version on the disk array. Similarly, to view cache metrics for XP24000 disk array, ensure that v60-08-05-00/00 is the minimum firmware version on the disk array. • The performance data is displayed for all the continuous access ports irrespective of whether you view the Sync/Async metrics or the CA Journal metrics.
Figure 21 Sync/Async Performance Metrics . P-VOL S-VOL Configuration Table 13 describes the configuration data for the selected P-VOLs and S-VOLs. Table 12 P-VOL S-VOL Configuration Configuration data Description Pri Ser# Disk array serial number. Ldev LDEV configured as the P-VOL or the S-VOL. Vol Type Type of volume, P-VOL or S-VOL. Ldev [MB] Size of the LDEV in MB. Rg RAID group to which the LDEV belongs. Raid RAID classification for the RAID group. Type RAID type for the RAID group.
P-VOL S-VOL LDEV performance metrics Table 13 describes the performance metrics of P-VOLs and S-VOLs. Table 13 P-VOL S-VOL LDEV performance metrics Performance metrics Unit Description LDEV number Logical Device name. RG number RAID group identifier. AvgIO number Average Front-end I/Os. Wr% % Average Write percentage. Seq% % Average Sequential I/O percentage. r_H% % Average Read Cache Hit percentage. KB/IO KB/IO Average I/O Size. KB/s KB/s Average Throughput.
NOTE: The RAID group performance metrics of a LDEV is not available if it is configured as a THP, smart pool, or external volume. Table 14 PVOL SVOL RAID Group performance metrics Performance metrics Unit Description RG number RAID group identifier. AvgIO number Average Front-end I/Os. Wr% % Average Write percentage. Seq% % Average Sequential I/O percentage. r_H% % Average Read Cache Hit percentage. kB/IO KB/IO Average I/O size. KB/s KB/s Average Throughput.
Performance metrics Unit Description CmUs[MB] number Cache usage [MB] of the CLPR. CmWr[MB] number Write cache usage [MB] of the CLPR. CmSf[MB] number Side File usage [MB] of the CLPR. CmRdH number Cache random read hits of the CLPR. CmUs% % Cache utilization [%] of the CLPR. CmWr% % Write cache utilization [%] of the CLPR, max=70%.
CA Journal Metrics The CA Journal metrics includes the configuration data of P-VOLs and S-VOLs that belong to a selected CTG.
For description of performance metrics related to P-VOLs, S-VOLs, and associated RAID groups, ports, CLPRs, see Sync/Async Metrics. The following sections describe the performance metrics related to journal groups, journal volumes, and associated RAID groups, CLPRs. JNL (Journal Group) metrics Table 17 describes the performance metrics of journal group associated with the P-VOLs and S-VOLs that belong to the selected CTG.
Host Group metrics The Host Group metrics include performance metrics for the selected disk array and the following additional components: • • • • • • • Array Host groups Ports LDEVs RAID groups CPU DKC The Output screen and the seven output files .csv files that are generated, one file for each component, contain performance metrics pertaining to host groups, ports, LDEVs, RAID groups, CPU, DKC, and Array utilization of the selected XP or P9000 disk arrays.
Figure 23 Output screen for a XP disk array . Figure 24 shows the Output screen for a P9000 disk array.
Figure 24 Output screen for a P9000 disk array . Array Performance Metrics Table 14 describes the Array performance metrics.
Performance metrics Unit Description MinMB MB/s Minimal throughput of the last 60 seconds MaxMB MB/s Maximum throughput of the last 60 seconds AvgMB MB/s Average throughput of the last 60 seconds Host Group performance metrics Table 15 describes the Host Group performance metrics.
Performance metrics Unit Description MinKB KB/s Minimal throughput of the last 60 seconds MaxKB KB/s Maximum throughput of the last 60 seconds AvgKB KB/s Average throughput of the last 60 seconds LDEV performance metrics Table 21 describes the LDEV performance metrics.
RAID group performance metrics Table 22 describes the RAID group performance metrics. NOTE: The RAID group performance metrics of a LDEV is not available if it is configured as a THP, smart pool, or external volume.
CPU performance metrics Table 23 describes the CPU performance metrics. Table 23 CPU performance metrics Performance metrics Unit Description Ser number Serial number of the array CH slot number. Slot string For P9000 disk arrays, the slot refers to the MP blade location. Figure 24 shows the slots are shown as MA and MP Type string CH PCB type (Fibre/SCSI/FICON/DKA). For P9000 disk arrays, the type is displayed as MPPK. For an XP disk array, Min% indicates the minimum CPU utilization on PCB [%].
Performance metrics Unit Description For an XP disk array, MP3 is the CHA PCB Busy Time for CPU 3 (if installed). MP3 number MP4 number For an XP disk array, MP4 is the CHA PCB Busy Time for CPU 4 (if installed). MP5 number For an XP disk array, MP5 is the CHA PCB Busy Time for CPU 5 (if installed). MP6 number For an XP disk array, MP6 is the CHA PCB Busy Time for CPU 6 (if installed). MP7 number For an XP disk array, MP7 is the CHA PCB Busy Time for CPU 7 (if installed).
5 Introduction to P9000Sketch This section gives an overview of P9000Sketch. Overview P9000Sketch is a tool provided by HP to enable you to view the performance metrics of different components of an XP or a P9000 disk array in a graphical format. The performance metrics obtained on monitoring the selected XP or the P9000 disk array’s host groups, ports, LDEVs, RAID, CPU, and DKC Groups including the array level metrics for a specified duration are stored in seven comma-separated files (.
Introduction to P9000Sketch
6 Installing P9000Sketch This chapter lists the supported environment for P9000Sketch (previously called XPSketch) and describes the installation for P9000Sketch. Supported Windows platforms For information on the list of supported platforms, see the latest HP StorageWorks P9000 Performance Advisor Software OS Support Matrix available at www.hp.com/go/PerformanceAdvisor-support-docs. NOTE: • Use Microsoft Internet Explorer (IE) 7.0 when using Windows 2008 and IE 6.
4. 5. 6. 7. On the Header menu, select Support. The screen displaying Table of Contents appears. Under Tools, click the P9000Sketch (Windows 32-bit) link to download the XPSketch.zip file to a P9000 Performance Advisor server, your local system, or a remote system. After the download, the P9000Sketch tool can work independently of P9000 Performance Advisor. Extract the contents of the zip file to a location of your choice on the designated system. Double-click Run.bat to execute P9000Sketch.
7 Viewing performance metrics in P9000Sketch This section describes loading the .csv files, setting the Java heap size value, and viewing performance metrics in P9000Sketch. Loading the Comma separated file The performance metrics obtained on monitoring the selected XP or the P9000 disk array’s host groups, ports, LDEVs, RAID, CPU, and DKC groups including the array level metrics for a specified duration are stored in seven .csv files, one file for each component. The .
Setting the Java heap size value At a time, the number of metrics that can be loaded in P9000Sketch depends on the minimum and maximum Java heap size values specified for P9000Sketch. The default minimum and maximum Java heap size values are 70 MB and 128 MB respectively. You can increase the maximum Java heap size value by modifying a property value in run.bat. By default, when you open run.
Figure 26 Performance report generated using P9000Sketch . You can select multiple metrics at a time. Accordingly, multiple graphs are plotted in the Graph Area, as shown in figure below. This is especially useful when you want to analyze the performance metrics of components across different time intervals. Different color codes are used to differentiate the various metrics when they are plotted in the Graph Area.
Figure 27 Multiple graphs plotted for multiple metric selection . You can also view the Metrics Available, Samples Available, and Samples Displayed data for the CSV file that is currently loaded in P9000Sketch. Point to a location on the Metrics label, as shown in Figure 28. Figure 28 shows the available metrics and samples displayed on the screen. Figure 28 Metric available, samples available, and samples displayed .
Understanding performance metrics in P9000Sketch This section describes the Array, Host Group, Port, LDEV, RAID, CPU, DKC Group, and continuous access journals performance metrics.
Performance Metrics Description MinKB Minimal throughput of the last 60 seconds MaxKB Maximum throughput of the last 60 seconds AvgKB Average throughput of the last 60 seconds Table 28 describes the LDEV performance metrics.
Performance Metrics Description IO response time [ms] Average I/O Response Time Back-end to Front-end IO ratio [%] Back-end / Front-end I/O ratio Cache lines staged/destaged [1/s] Back-end I/O r_ms [ms] Average Read Response time w_ms [ms] Average Write Response time ms^ [ms] Maximum of (Maximum Read Response time and Maximum Write Response time) r_ms^ [ms] Maximum Read Response time w_ms^ [ms] Maximum Write Response time Table 30 describes the CPU performance metrics.
Performance Metrics Description DKA to cache memory utilization [%] DKA to cache memory Xbar utilization [%] Cache usage [MB] Cache usage for CLPR0 [MB] Write cache usage [MB] Write cache usage for CLPR0 [MB] Side File usage [MB] Side File usage for CLPR0 [MB] Cache random read hits Cache random read hits for CLPR0 Cache utilization [%] Cache utilization for CLPR0 Write cache utilization [%] Write cache utilization [%] for CLPR0, max=70% Table 32 describes the CLPR performance metrics.
8 Working with charts in P9000Sketch This section describes viewing, modifying, saving, and printing charts in P9000Sketch. It also describes restoring the auto range settings on the chart. Viewing charts You can zoom in or zoom out on a chart on either the Domain Axis, Range Axis, or both. To zoom in, on the Options menu, point to Zoom In and select one of the following options: • Both— Select this option if you want to zoom in on both Domain Axis and the Range Axis.
• Clear the Show Title checkbox if you do not want the chart title to be displayed. • Under the Plot tab: • Go to Appearance tab to change the appearance and orientation of the chart. • Go to Domain Axis or Range Axis tabs to: • Change the other general settings for Domain Axis or Range Axis • Clear the Show Tick Labels checkbox if you do not want the labels to be displayed on the Domain Axis or the Range Axis.
A P9000Watch use case scenarios Scenario 1: Port I/O spike Business case Periodic port I/O spikes are observed in P9000 Performance Advisor. Objective Locate the offending host group/application. Resolution P9000Watch can be used to find the hot spot by collecting the performance data for very short intervals, such as, 10 seconds. Perform the following steps to find the hot spot: 1. 2. Select the affected port (You can find the affected port using P9000 Performance Advisor).
Objective Confirm the observation using P9000Watch. Resolution In this case, P9000Watch can help you to isolate the XP or the P9000 disk array’s performance from the application’s performance. Using P9000Watch, perform the following steps: 1. 2. 3. 4. Select the host group or server where the application is running. All ports attached to the host groups are displayed. Select all ports attached to the host groups. Select all LDEVs and RAID groups attached to the ports.
B Understanding write ratio in P9000Watch The following screen shows the performance of the entire RAID group 01-04 being collected with the performance of LDEVs 01:6c, 01:6d, 02:a3, 02:a4, and 02:a5. The LDEVs in RAID group 01-04 are exposed only through port 1A. There are no I/O activities or LDEVs reported on this port because there is no I/O activity in port 1A and these LDEVs are not visible through any other port.
NOTE: We can conclude all the front-end I/Os on the RAID group are writes because the r_H% (cache read hit %) is 0; that is, there are no front-end reads.
C Relationship between LDEV I/O response time and Write ratio We cannot establish a relationship between the LDEV I/O response time and Write ratio because: • LDEV I/O response time is dependent on both front-end reads and front-end writes. • Write ratio provides only the write percentage in the I/Os. NOTE: The LDEV I/O response time shown by P9000Watch is the average I/O response time measured in milliseconds (that is, both reads and writes together are responsible for variations in this value).
Relationship between LDEV I/O response time and Write ratio
D Comparing LDEV response time metrics in P9000 Performance Advisor and P9000Watch Maximum values of LDEV response time in P9000 Performance Advisor and P9000Watch The maximum values of LDEV response time in P9000 Performance Advisor cannot be compared with the response time values in P9000Watch because P9000 Performance Advisor displays the I/O response time as separate metrics for read and write, respectively.
Comparing LDEV response time metrics in P9000 Performance Advisor and P9000Watch
9 Support and other resources Contacting HP HP technical support For world wide technical support information, see the HP support website: http://www.hp.
• P9000Info Release Notes To find related documents, browse to the Manuals page of the HP Business Support Center web site: http://www.hp.com/support/manuals For related documentation, navigate to the Storage section, select a storage category (Storage Software > Storage Device Management Software and product. Websites • HP.com http://www.hp.com • HP Storage http://www.hp.com/go/storage • HP Manuals http://www.hp.com/support/manuals • HP download drivers and software http://www.hp.
Typographic conventions Table 34 Document conventions Convention Element Blue text: Table 34 Cross-reference links and email addresses Blue, underlined text: http://www.hp.
Support and other resources
Glossary Array Control Processor (ACP) ACP is used in the XP disk arrays prior to the XP24000 Disk Array. With the introduction of the XP24000 Disk Array, the DKA has replaced ACP. The DKA is also applicable for the P9000 disk arrays. ACP handles the transfer of data between the cache and the physical drives held in the DKUs. The ACPs work in pairs, providing a total of eight SCSI buses. Each SCSI bus associated with one ACP is paired with a SCSI bus on the other ACP pair element.
CHIP Channel host interface processor. Synonymous with the term CHA. Command Line User Interface (CLUI) In addition to its GUI, P9000 Performance Advisor also provides a command-line utility called the CLUI to monitor real-time performance of the XP and the P9000 disk arrays. The CLUI allows you to monitor performance, set alarms, and configure host information using commands and scripts. You can execute commands in the CLUI and view the same data that is displayed on the GUI.
the DSF allows the software to interact with a device driver using the standard input or the output system calls. emulation mode The LDEVs associated with each RAID group are assigned an emulation mode that makes them operate like OPEN system disk drives. The emulation mode determines the size of an LDEV. OPEN-3: 2.46 GB OPEN-8: 7.38 GB OPEN-9: 7.42 GB OPEN-E: 13.
MP blades The MP blades are the microprocessor blades in the P9000 disk arrays. Each MP blade has four MPs residing on it. The MPs that reside on the CHAs and the DKAs in the XP disk arrays form part of the MP blades in the P9000 disk arrays. Multiprocessor (MP) In an XP disk array, the MPs are installed on the CHAs and the DKAs. The MPs on a CHA are addressed as CHPs and the MPs on a DKA are addressed as DKPs. In a P9000 disk array, the MPs do not reside on the CHAs and DKAs.
Storage Logical Partition (SLPR) NOTE: The SLPR component is applicable only for the XP disk arrays. It does not exist in the P9000 disk arrays. As a result, the SLPR-related data is not displayed in P9000 Performance Advisor for the P9000 disk arrays. The SLPR is a partition of the RAID500 to which the host ports (1 or more) and the CLPRs (1 or more) are assigned. The SLPR0 will always exist (cannot be deleted). Sometimes, the SLPR acronym includes an additional word.
Glossary
Index A Archival Frequency, 44 Array menu, 24 Average read response time, 83 write percentage, 79 write response time, 83 C Collection Update Interval, 44 conventions document, 87 text symbols, 87 D Data Collection Time Limit, 43 Data Split Time, 43 document conventions, 87 prerequisites, 85 related documentation, 85 documentation providing feedback, 85 F feedback documentation, 85 H help obtaining, 85 Host Groups clearing host groups, 32 screen, 29 selecting host groups, 31 viewing host groups, 30 HP t
P9000Watch commands, 19 components, 16 installing, 13 menus, 24 performance metrics, 45 uninstalling, 16 P9000Watch files CSV file, 16 P9000Watch.log, 16 settings.ini, 16 wagent.exe, 16 XPWatch.