
P9000Watch and P9000Sketch Reference guide for HP StorageWorks P9000 Performance Advisor v5.2 (T1789-96319, May 2011)
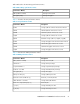


DescriptionPerformance Metrics
Maximum of (Maximum Read Response time and
Maximum Write Response time)
ms^ [ms]
Maximum Read Response time
r_ms^ [ms]
Maximum Write Response time
w_ms^ [ms]
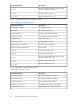
Table 23 describes the RAID group performance metrics.
Table 23 RAID group performance metrics
DescriptionPerformance Metrics
Average Front-end I/OsIOPS (TotalRd + TotalWr)
Average Write percentageWrite Ratio %
Average Sequential I/O percentageSequential IO ratio %
Average Read Cache Hit percentageRead hits % for LDEV
Average ThroughputThroughput [KB/s]
Average I/O Response TimeIO response time [ms]
Back-end / Front-end I/O ratioBack-end to Front-end IO ratio [%]
Back-end I/OCache lines staged/destaged [1/s]
Average Read Response time
r_ms [ms]
Average Write Response time
w_ms [ms]
Maximum of (Maximum Read Response time and
Maximum Write Response time)
ms^ [ms]
Maximum Read Response time
r_ms^ [ms]
Maximum Write Response time
w_ms^ [ms]
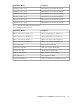
Table 24 describes the CPU performance metrics.
Table 24 CPU performance metrics
DescriptionPerformance Metrics
Minimum CPU utilization on PCB[%]Minimum Utilization[%]
Maximum CPU utilization on PCB[%]Maximum Utilization[%]
Average CPU utilization on PCB[%]Average Utilization[%]
CHA PCB Busy Time for CPU 0(if installed)Utilization for MP 0 0[1/s]
CHA PCB Busy Time for CPU 1(if installed)Utilization for MP 1 0[1/s]
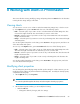
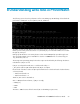
Viewing performance metrics in P9000Sketch62