
P9000Watch and P9000Sketch Reference guide for HP StorageWorks P9000 Performance Advisor v5.2 (T1789-96319, May 2011)
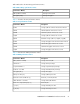
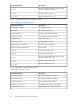
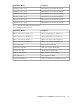


Table 20 describes the Host Group performance metrics.
Table 20 Host Group performance metrics
DescriptionPerformance Metrics
Average Front-end I/OsIOPs (TotalRd + TotalWr)
Average ThroughputThroughput [MB/s]
Table 21 describes the Port performance metrics.
Table 21 Port performance metrics
DescriptionPerformance Metrics
Average I/O rate of the last measurement intervalCurIO
Minimal I/O rate of the last 60 secondsMinIO
Maximum I/O rate of the last 60 secondsMaxIO
Average I/O rate of the last 60 secondsAvgIO
Calculate average I/O size (=avgKB / avgI/O)KB/IO
Average throughput of the last measurement intervalCurKB
Minimal throughput of the last 60 secondsMinKB
Maximum throughput of the last 60 secondsMaxKB
Average throughput of the last 60 secondsAvgKB
Table 22 describes the LDEV performance metrics.
Table 22 LDEV performance metrics
DescriptionPerformance Metrics
Average Front-end I/OsIOPS (TotalRd + TotalWr)
Average Write percentageWrite Ratio %
Average Sequential I/O percentageSequential IO ratio %
Average Read Cache Hit percentageRead hits % for LDEV
Average ThroughputThroughput [KB/s]
Average I/O Response TimeIO response time [ms]
Back-end / Front-end I/O ratioBack-end to Front-end IO ratio [%]
Average LDEV I/O utilizationLDEV Utilization % for LDEV
Back-end I/OCache lines staged/destaged [1/s]
Average Read Response time
r_ms [ms]
Average Write Response time
w_ms [ms]
P9000Watch and P9000Sketch Reference Guide 61