
P9000Watch and P9000Sketch Reference guide for HP StorageWorks P9000 Performance Advisor v5.2 (T1789-96319, May 2011)
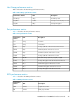


DescriptionUnit
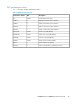
Performance
metrics
Average I/O sizeKB/IOkB/IO
Average ThroughputKB/sKB/s
Average I/O Response time within back-end arraymsms
Average Read Response timemsr_ms
Average Write Response timemsw_ms
Maximum of (Maximum Read Response time and Maximum
Write Response time)
msms^
Maximum Read Response timemsr_ms^
Maximum Write Response timemsw_ms^
Front-end I/O Density [IOPS/GB]numberFeD
Back-end / Front-end I/O rationumberBe/Fe
Average RAID group I/O utilization%RG%
Back-end I/OnumberBe
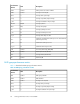
CPU performance metrics
Table 18 describes the CPU performance metrics.
Table 18 CPU performance metrics
DescriptionUnit
Performance
metrics
Serial number of the arraynumberSer
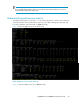
CH slot number.
For P9000 disk arrays, the slot refers to the MP blade
location.
Figure 21 shows the slots are shown as MA and MP
stringSlot
CH PCB type (Fibre/SCSI/FICON/DKA).
For P9000 disk arrays, the type is displayed as MPPK.
stringType
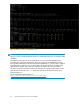
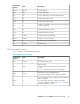
For an XP disk array, Min% indicates the minimum CPU util-
ization on PCB [%].
For a P9000 disk array, Min% indicates the minimum
processor utilization on an MP blade. In Figure 21 the Min%
indicates the utilization of MP3.
%Min%
P9000Watch and P9000Sketch Reference Guide 47