
P9000Watch and P9000Sketch Reference guide for HP StorageWorks P9000 Performance Advisor v5.2 (T1789-96319, May 2011)

Functional representation
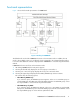
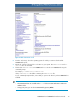
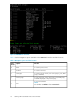
Figure 1 shows the functional representation of P9000Watch.
Figure 1 Working of P9000Watch
.
The default mode in which the P9000Watch executes is the Interactive mode. In addition, the CLI
mode is also available, where you can directly execute commands in the command prompt window
to view the same data that is otherwise displayed when P9000Watch is executed using the Interactive
method.
P9000Watch functions as follows in the Interactive mode:
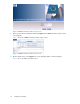
1. On starting P9000Watch, the Array menu appears.
2. Selecting the desired array displays the list of host groups connected to it.
3. Selecting one or more host groups displays the list of ports connected to them.
4. Selecting the required ports displays the Pick LDEVs/RAID Groups Selection Scheme.
This scheme offers the following options:
• Filter LDEVs by RAID Groups
If you select this option, the RAID Groups menu appears. Select one or more RAID groups to
view the LDEV menu. The LDEV menu lists all the LDEVs within the selected RAID groups. Select
the required LDEV to collect and view the performance data.
• Filter RAID Groups by LDEVs
If you select this option, the LDEV menu appears. Select one or more LDEVs to view the RAID
Group menu. The RAID Group menu lists all the RAID groups within the selected LDEVs. Select
the required RAID groups to collect and view performance data.
P9000Watch and P9000Sketch Reference Guide 11